
User Manual

17
5.5.4 Listening to Audio Records
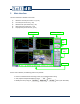
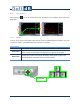
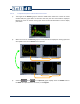
When audio signals have been recorded during a measurement (see section 8.5, p. 56), a red line is
displayed on the top of the Historic graph. The start position and length of the line corresponds to
the recording period.
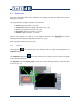
To listen to the recording, the Historic graph must be magnified. Click on the icon on the top left
corner of the graph to magnify the graph.
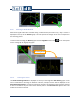
5.5.4.1 Selecting the record
The Audio Recording Indicator is displayed on the top of the magnified Time History graph. In the
case of simultaneous recordings on different channels, multiple red lines will be displayed on the
Audio Recording Indicator. The top line represents channel 1 and the bottom line represents channel
4. Click on the red line of your choice at the desired position. The Record Cursor appears with a dot
located on the chosen channel.
Recording Period