
User Manual

26
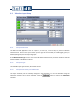
7.1 Display Area Disposition
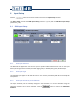
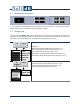
1, 2 or 4 graphs can be displayed at the same time. Click one of the icons in the upper part of the
Display Setup to select the desired number of graphs for display.
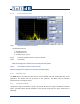
7.2 Display Type
For each zone, the Display Type controls allow the user to select the type of display. A display zone
will either display SLM data, vibration data or Camera according to the leftmost menu ring of the
display type. Then a display type can be selected from the rightmost menu ring.
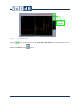
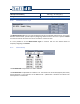
SLM display.
- SLM Historic Graph of global levels (see section 7.2.1)
- SLM 1/3 Octave Spectrum Graph (see section 7.2.2)
- SLM FFT Spectrum Graph (see section 7.2.3)
- SLM Numeric indicator of global levels (see section7.2.4)
- SLM Statistics Graph of SPL global levels (see section 7.2.5)
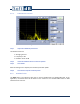
Vibration display (acceleration, velocity or position)
- Vib Historic Graph of global levels (see section 7.2.6)
- Vib 1/3 octave Spectrum Graph (see section 7.2.7)
- Vib FFT Spectrum Graph (see section 7.2.8)