
User Manual

28
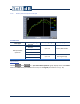
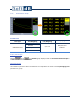
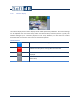
7.2.1 SLM Historic Graph
Available data
Data Type
Time Weighting
Freq Weighting
Display Type
SLM Global level
SPL Slow
A, C or Z
Instant, Max or Min
SPL Fast
SPL Impulse
SPL Peak
Leq
A, C or Z
Running Average
SEL
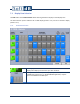
Length of the historic graph
The historic displays the last 1000 measured samples. Past samples may be displayed once the
acquisition has been stopped (see section 5.5.3.1, p. 16).
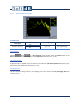
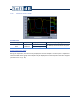
Wav recording indicator
If an audio record was recorded during the measurement, a red line will be displayed on the top of
the historic graph. To listen to the recorded file, click on the icon to access the magnified view of
the Historic Graph and its audio record controls (see section 5.5.4, p. 17).