
User Manual

29
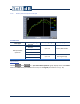
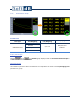
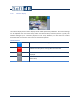
7.2.2 SLM 1/3 Octave Spectrum Graph
Available data
Data Type
Time Weighting
Freq Weighting
Display Type
SLM 1/3 Octave
Spectrum
SPL Slow
A, C or Z
Instant, Max or Min
SPL Fast
SPL Impulse
SPL Peak
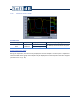
Leq
A, C or Z
Running Average
SEL
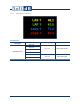
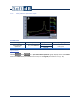
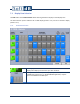
Legend Values
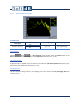
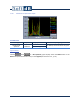
Selecting versus on a 1/3 Octave Band Spectrum graph displays either the Global
value or the Band value (associated to the cursor) on the Legend (see section 5.5.3.1, p. 16).