
User Manual

30
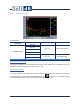
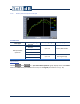
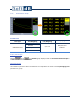
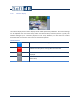
7.2.3 SLM FFT Spectrum Graph
Available data
Data Type
Time Weighting
Freq Weighting
Display Type
SLM FFT Spectrum
Leq
A, C or Z
Running Average
SEL
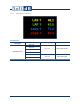
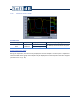
Legend Values
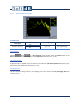
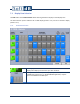
Selecting versus on a FFT Spectrum graph displays either the Global value or the
Band value (associated to the cursor) on the Legend (see section 5.5.3.1, p. 16).
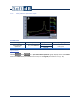
FFT High Pass Filter
A high pass filter is applied on the FFT spectrum to match the 1/3 Octave Spectrum frequency span,
which is 6.3 Hz to 20 kHz (see section 6.1.6, p.21).
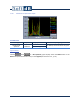
Averaging Period
The FFT spectrum being a Leq FFT, its averaging time is the same as the Leq Averaging Time (see
section 0, p. 12).