
User Manual


33
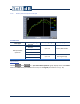
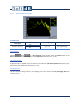
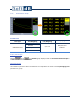
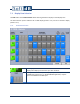
7.2.6 Vibration Historic Graph
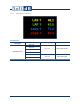
Available data
Data Type
Input
Display Parameter
Freq Weighting
Vibration Global
level
X, Y, Z or
SUM XYZ
Instant
For details, see the section 6.2.6, p.24
Average
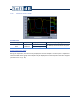
Length of the historic graph
During the acquisition, the historic only displays the last few samples. The time span is adjusted to
match the SLM historic graph. Past samples may be displayed once the acquisition has been stopped
(see section 5.5.3.1, p. 16).