
User Manual

35
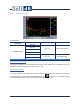
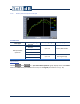
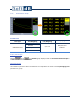
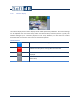
7.2.8 Vibration FFT Spectrum Graph
Available data
Data Type
Input
Display Parameter
Freq Weighting
Vibration FFT
spectrum
X, Y, Z or
SUM XYZ
Instant
For details, see the section 6.2.6, p.24
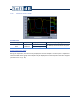
Average
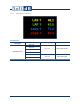
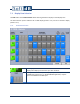
Legend Values
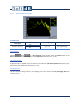
Selecting versus on a FFT Spectrum graph displays either the Global value or the
Band value (associated to the cursor) on the Legend (see section 5.5.3.1, p. 16).