
User Manual

40
7.4 X axis and Y axis properties
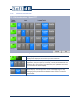
The X axis range automatically adjusts to the contained data.
However, the 1/3 octave spectrum and FFT spectrum graphs X axis
(frequency axis) range can be set manually to zoom in on a specific
portion of the spectrum. For FFT spectrum specifically, the X axis
(frequency axis) mapping can be set to linear or logarithmic.
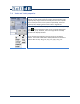
The Y axis range is automatically adjusted to contained data by clicking
on the button at the bottom left corner of a graph display (see
section 5.5.2, p. 15). However, the Y axis range can be manually
adjusted in the display interface.
The unit format of the vibration level can be set in the display
interface. The format of SLM data is always dB while the format of
vibration data can vary: dB, g rms, m/s² rms, (m/s² rms)², etc.