
Manual


11
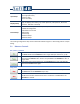
Launches the Record Setup (see section 8 ,p. 31)
Comment / Tag Button
Allows the user to write a comment on the measurement before it starts. When
the measurement starts, this button becomes the Tag button.
Tags events during a measurement.
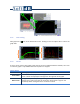
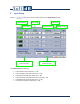
5.5 Display Area
One, two or four graph areas can be displayed in the Display Area. During a measurement, data is
displayed in real-time.
For each graph area, five types of display can be selected:
• Time History Graph (see section 7.2.1 p. 23)
• 1/3 Octave Band Spectrum Graph (see section 7.2.2 p. 24)
• FFT Spectrum Graph (see section 7.2.3 p. 25)
• Numerical Indicators (see section 7.2.4 p. 26)
• Statistics Graph (see section 7.2.5 p27)
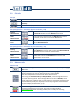
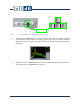
Each of these displays can show up to four different elements. The button allows
selecting the desired display configuration (see section 7, p. 21).
Note: The display updates up to every 1/4 s.
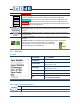
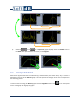
5.5.1 Magnifier
Each graph has a icon at the top left corner. Clicking on this icon makes the graph appear on a
magnified display.
The magnified display has a icon at the top left corner. Clicking on this icon returns the graph to
its initial size and position.
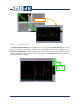
The magnified view of a time history graph contains the controls allowing listening to audio files (see
section 5.5.4 p. 14).