
Manual


13
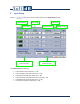
5.5.3.1 Complementary Actions Associated to the Cursors
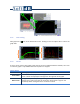
1) The length of the Historic graph is limited to 1000 values. When the number of values
excides 1000, the graph slides on the left so that only the most recent data is displayed.
Moving the cursor on the left of the graph moves the time window back in time to display
past values.
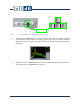
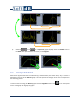
2) When the cursor on the Historic graph is moved, the values displayed in other graph areas
will update to the current Historic cursor position.