
Manual


14
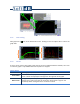
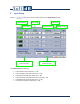
3) Selecting versus on a Spectrum graph displays either the Global value or
the Band value (associated to the cursor) on the Legend.
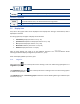
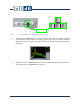
5.5.4 Listening to Audio Records
When audio signals have been recorded during a measurement (see section 8.5 p. 45), a red line is
displayed on the top of the Historic graph. The start position and length of the line corresponds to
the recording period.
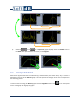
To listen to the recording, the Historic graph must be magnified. Click on the icon on the top left
corner of the graph to magnify the graph.