
Manual

21
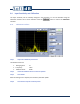
7 Display Setup
During a measurement, all acoustical parameters are calculated and available for display.
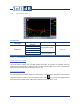
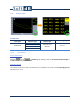
The button launches the Display Setup interface used to define:
• Graph number and disposition (see section 7.1, p. 21)
• Graph type (see section 7.2, p. 22)
• Data to display on each graph (see section 0, p. 29)
• Graph X axis properties (see section 0, p. 30)
• Graph Y axis range (see section 7.5, p. 30)
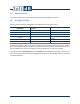
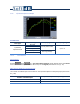
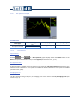
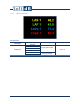
7.1 Graph Number and Disposition
1, 2 or 4 graphs can be displayed at the same time. Click one of the icons in the upper part of the
Display Setup to select the desired number of graphs for display.
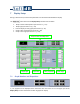
Graph number and disposition
Graph type Graph data X axis properties Y axis range