
Manual

23
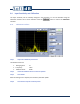
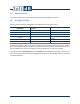
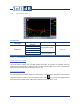
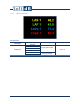
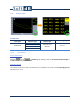
7.2.1 Time History Graph
Available data
Data Type
Measure Type Display Type
Freq Weighting
Global level
SPL Slow
Instant, Max or Min
A, C or Z
SPL Fast
SPL Impulse
SPL Peak
Leq
Running Average
SEL
7.2.1.1 Particularities
Length of the historic graph
The Time History displays the last 1000 measured sample. All samples are available once the
measurement has stopped. To display the past samples, drag the graph cursor so that it is positioned
before the start of the graph (see section 5.5.3.1, p. 13).
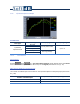
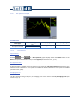
Audio recording indicator
If a audio record was recorded during the measurement, a red line will be displayed on the top of the
Time History Graph. To listen to the recorded file, click on the icon to access the magnified view
of the Time History Graph and its audio record controls (see section 5.5.4, p. 14).