
Manual


24
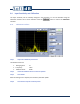
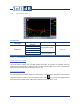
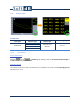
7.2.2 1/3 Octave Spectrum Graph
Available data
Data Type
Measure Type Display Type
Freq Weighting
1/3 Octave
Spectrum level
SPL Slow
Instant, Max or Min
A, C or Z
SPL Fast
SPL Impulse
Leq
Running Average
SEL
7.2.2.1 Particularities
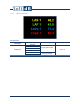
Legend Values
Selecting versus on a 1/3 Octave Band Spectrum graph displays either the Global
value or the Band value (associated to the cursor) on the Legend (see section 5.5.3.1, p. 13).
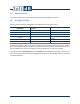
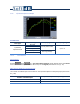
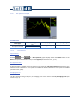
Effect of Input Enabling on Frequency Span
The number of enabled inputs has an effect on the 1/3 Octave Spectrum Frequency Span (see section
6.1, p.18):
Number of Enabled Inputs
1/3 Octave Spectrum Frequency Span
1 to 2
6.3 Hz to 20 kHz
3 to 4
20 Hz to 20 kHz