
Manual

25
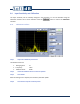
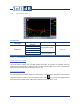
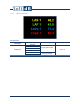
7.2.3 FFT Spectrum Graph
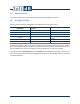
Available data
Data Type
Measure Type Display Type
Freq Weighting
FFT Spectrum level
Leq
Running Average
A, C or Z
SEL
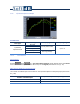
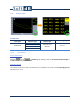
7.2.3.1 Particularities
Legend Values
Selecting versus on a FFT Spectrum graph displays either the Global value or the
Band value (associated to the cursor) on the Legend (see section 5.5.3.1, p. 13).
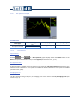
FFT High Pass Filter
A high pass filter is applied on the FFT spectrum to match the 1/3 Octave Spectrum frequency span,
which is 6.3 Hz to 20 kHz if 1 or 2 inputs are enabled an 20 Hz to 20 kHz if 3 or 4 inputs are enabled
(see section 6.6, p.20).
Averaging Period
The FFT spectrum being a Leq FFT, its averaging time is the same as the Leq Averaging Time (see
section 5.3, p. 9).