
Manual

27
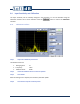
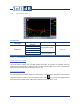
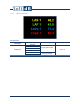
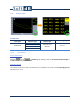
7.2.5 Statistic Graph
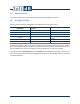
Available data
Data Type
Measure Type Display Type
Freq Weighting
Global level
SPL Slow
Max, Min and
Statistics
A, C or Z
SPL Fast
SPL Impulse
SPL Peak
7.2.5.1 Particularities
Graph / Data Display
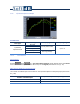
Selecting versus on a Statistic graph displays either the Cumulative Statistic Graph or
a Table of most common Percentiles.
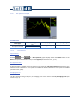
Calculation Period
The calculation period on which the statistics are computed is the same as the Leq Averaging Time
(see section 5.3, p. 9).