
Manual

30
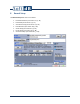
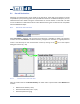
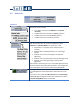
7.4 X Axis Properties
The X axis range is automatically adjusted to the contained data. However, the 1/3 octave spectrum
and FFT spectrum graphs X axis (frequency axis) range can be set manually to zoom in on a specific
portion of the spectrum. For FFT spectrum specifically, the X axis (frequency axis) mapping can be set
to linear or logarithmic.
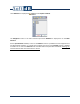
7.5 Y Axis Range
The Y axis range is automatically adjusted to contained data by clicking on the button at the
bottom left corner of a graph display (see section 5.5.2, p. 12). However, the default Y axis range can
be set by modifying the associated field in the Display Setup Interface (see section 7, p. 21).