
Manual

63
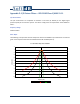
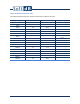
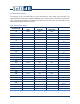
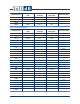
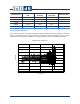
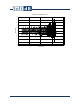
Shape Test Numerical Results at 1 kHz
The following table presents the numerical results of the shape test at 1 kHz:
Frequency (Hz)
Low limit (dB) Measurement (dB)
High limit (dB)
185.5
-inf -96.0
-75.0
327.5
-inf -85.1
-62.0
531.4
-inf -61.1
-42.5
772.6
-inf -28.2
-18.0
891.3
-4.5 -3.0
-2.3
919.6
-1.1 -0.3
0.15
947.0
-0.4 0.0
0.15
974.0
-0.2 0.0
0.15
1000.0
-0.15 0.0
0.15
1026.7
-0.2 0.0
0.15
1055.8
-0.4 0.0
0.15
1087.5
-1.1 -0.3
0.15
1122.0
-4.5 -3.0
-2.3
1294.4
-inf -28.4
-18.0
1881.7
-inf -61.8
-42.5
3053.7
-inf -86.9
-62.0
5392.0
-inf -96.7
-75.0