
User Guide Manual

Tenor Data Logger Soft dB inc.
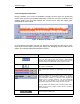
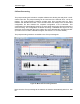
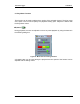
4.4.3 Time/Spectrum Indicators
During acquisition, four curves are available to display the time signal, the global level
historic or the spectrum of a selected input/output. These four curves are presented in two
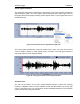
separate graphs. The top graph presents the A and B curves while the bottom graph
presents the C and D curves.
Figure 14: Graph for A and B curves
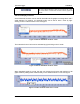
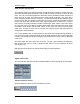
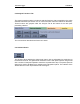
For both AB and CD graphs, the user can select the input/output and the type of curve.
Some other functions allow controlling the display and averaging process of AB and CD
graphs. The following table describes these functions:
Fonction Description
This button allows making an auto scale of the Y-axis for the A/B
curves. The auto scale is done once and the Y scale remains
fixed after that. As described later in this section, there are some
advanced functions that allow better control of X and Y scale.
This control allows selection of a linear, a dB or a dBA display for
both Y-axes on the A/B graph.
These controls allow selecting the input/output for the A and B
curves.
The type of display for the A and B curves are: 1) Time signal 2)
Global Level Historic 3) Instantaneous Spectrum 4) Spectrum
(Fast Exponential Average) 5) Spectrum (Slow Exponential
Average) and 6) Average Spectrum. The slow exponential
average uses a time constant of one second while the fast
exponential average uses a time constant of 1/8 of a second.
Note: The Global Level Historic graph is limited to 6500 data to
minimize the PC memory usage. It means about 9 minutes of
historic at 48.8 kHz.
This control allows resetting the global level historic or the
spectrum average of A/B curves.
User Manual p. 23