
Consumption Monitoring
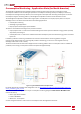
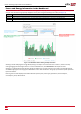
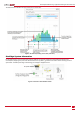
Table Of Contents

The following figure explains the meaning of colors in the graphs.
Figure 3: The Week tab, showing an area chart (zoomed-in)
StorEdge System Information
For StorEdge systems, the cloud-based monitoring platform also provides insight into household PV production and
consumption, displaying the power flow between the PV array, battery, grid and house loads as well as tracking real-time
system data. The battery discharge and discharge percentage is displayed as well.
Figure 4: Power flow in the Dashboard window
Consumption Monitoring - Application Note (for North America)
3