
User manual


2 Operation of the analyzer
17
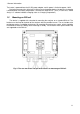
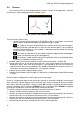
This feature allows user to perform quick visual assessment of mains parameters and their
compliance with the analyzer settings.
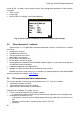
Screen 2 is shown in Fig. 6. It shows the measured values of RMS voltages and currents within the
tested system and the mains frequency.
Fig. 6. Screen 2 with the values of effective voltages and currents.
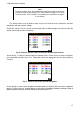
Screen 3 (Fig. 7) shows the active and passive power values. Power values of successive phases
are marked with numbers from 1 to 3. Total power values are displayed in the last line (marked as
P and Q).
Fig. 7. Screen 3 with active and reactive power.
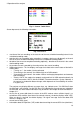
Screen 4 (Fig. 8) shows values of apparent distortion power (marked as SN) and values of apparent
power (S). When the user selected power measurement according to Budeanu method instead of
apparent power distortion, the device displays distortion power "D".
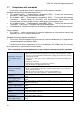
Note
To detect a phase error, the fundamental component of the measured se-
quence must be at least equal to 5% of the nominal voltage, or 1% of the
nominal current. If this condition is not fulfilled, the correctness of angles
is not verified.