
User manual
PQM-702, PQM-703 Operating Manual
34
At Harmonics card and Voltage tab select fields for THD average values and for voltage
harmonic amplitudes - uncheck other boxes. List "THD calculated from" may be set according to
own requirements.
At Interharmonics card and in Voltage and Mains signalling uncheck all the boxes.
Step 9: Settings of the measurement point has been properly prepared. The next step is to send
the settings to the analyzer. The memory card will be formatted. To do this press Send button. In
the displayed window confirm the deletion of all data on the memory card of the analyzer and
sending the new settings.
Step 10: The analyzer is ready to start recording acc. to specified settings. To begin recording at
the measurement point 1, select from the menu AnalyzerControl. In the displayed window select
from Current measurement point the first position (this field contains a list of names given to
individual measurement points) and start recording by clicking Start. Recording is indicated on the
display of the analyzer by flashing P1 symbol in the upper left corner. Recording may be continued
for any length of time; connection of the program with the analyzer is not required. During the
measurement, disconnect L1 lead from the tested network to simulate a voltage dip.
Step 11: Stop recording and upload data for the analysis. Display Control window (if not open yet)
by selecting AnalyzerControl. Click red button Stop. Click Analysis icon on the toolbar (or select
AnalyzerAnalysis from the menu), to open the window for loading previously recorded data for
analysis.
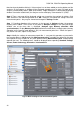
The window shows four bars of memory used for each of the measurement points. Check the box
next to the bar of measurement point No. 1. The size of recorded data is shown in the right side of
bar. After selecting it, Load data button is activated - press it. A window will appear showing data
loading progress. After loading all data, a window is displayed for saving downloaded data into the
disk. It is recommended to save the data to a desired location on the disk, in order to retrieve it for
further analysis. Indicate the location on the disk, name the file and click Save.
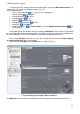
In the displayed window click on the horizontal bar indicating time of recording placed under text
Measurement point 1 (User) (after clicking it turns orange) and then click Data analysis.
Step 12: Data analysis. In the main window of data analysis four main buttons are available:
General (default view after loading data), Measurements, Events, Configuration. In General
view, on the right side, icons are displayed representing individual measurements, event and
recorded waveforms in the timeline. This graph with a large amount of data may be freely enlarged
to get more details.
Click Measurements button to display table with the values of all measured parameters, according
to selected averaging time. In this scenario, the selected averaging time is equal to 1 second,
therefore every second the analyzer recorded voltage THD and harmonics (frequency is always
measured every 10 seconds). Each line contains the data recorded in the consecutive second and
each column shows individual parameters.
After pressing Events you may view all the recorded events. In this scenario, the following voltage
events were recorded: swell, dip, interruption and transients. Each row in the table corresponds to
one detected event. When for a given event graphs are available (e.g. waveforms and RMS
1/2
graphs), as in this scenario, the last column contains the icon of saved graphs. After clicking it, the
user may display graphs related to a given event.
Step 13: Display the time plot for voltage and THD. To generate the graph, go to Measurements
(click Measurements button), select column headings for time (always select time column first),
voltage, L1, THD L1 (columns will be highlighted) and then click Plots and choose Time plot. A
window will be displayed with a graph containing two timeplots: L1 voltage and THD. The graph
may be freely enlarged, using the three markers mark specific points on the graph and read the
parameters of indicated points. The graph may be saved (in selected graphic format) by clicking
Save icon on the top toolbar.