
User manual

5 Power quality - a guide
87
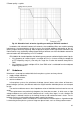
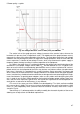
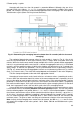
Fig. 39. Voltage tolerance curves: ANSI (ITIC) and CBEMA.
The vertical axis of the graph presents voltage in percent of the nominal value, whereas the
horizontal axis presents time (in logarithmic scale). The middle part of the graph (between curves)
represents the area of the correct operation of the device. The area above represents high voltage
conditions that may damage the device or trigger over-voltage protection, while the area under the
curves represents a situation of low voltage in mains, which may disconnect the power supply or
temporary power shortage resulting in incorrect operation of the equipment.
As shown in the graph, there is a relationship between the voltage value and the duration of the
disturbance. For example, voltage swell of 200% U
nom
and with duration of 1 ms, in typical cases,
does not result in failure or malfunctioning (point between curves), but an interference of such am-
plitude, which lasts for half-period of the mains may be have very adverse effects (the point above
two curves). Generally it is accepted that in a typical situation, events occurring in the power grid
when it comes to the value of the mains voltage, should fit in the middle area of the graph (between
curves) and then they should not lead to malfunction or damage to the connected equipment. Equip-
ment manufacturers (especially power adapters) often use this pattern while designing their prod-
ucts, in order to ensure their reliable operation and maintaining proper output voltage. Note, how-
ever, that the curve represents typical cases and cannot be a guarantee of correct operation for
each device, as tolerance for interferences is very different.
ITIC curve is the successor of the CBEMA curve developed by ITI in 1994, and later modified
to its present form in 2000. This curve has the form of two broken lines and is also known as ANSI
curve, as it was adapted by ANSI (American National Standards Institute). Both curves are pre-
sented in Fig. 39.
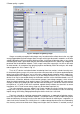
"Sonel Analysis 2" software provides the ability to modify the characteristic points of the curves
allowing user to adjust them to individual requirements.