
user manual
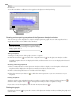
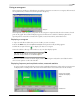
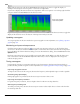
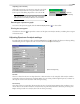
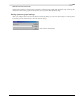

Table Of Contents
- Introduction
- Optimizing for Sound Forge
- Learning the Sound Forge Workspace
- Getting Started
- Navigating, Zooming, and Selecting
- Changing File Attributes and Formats
- Using Markers, Regions, and the Playlist/Cutlist
- Why use markers, regions, and the playlist?
- Using markers
- Using command markers in streaming media files
- Using regions
- Using the Regions List
- Using the playlist
- Displaying the playlist
- Adding regions to the playlist
- Understanding the playlist display
- Customizing the playlist display
- Repeating a region during playlist playback
- Playing from the playlist
- Arranging the playlist
- Replicating a region in the playlist
- Using stop points
- Deleting a region from the playlist
- Creating a new file from the playlist
- Configuring the playlist as a cutlist
- Saving a playlist/cutlist file
- Opening a playlist/cutlist file
- Copying the playlist/cutlist to the clipboard
- Recording, Extracting, and Burning
- Recording audio
- Recording manually
- Recording automatically
- Recording a specific length (punch-in)
- Choosing a recording mode
- Adjusting for DC offset
- Playing back recorded audio
- Using remote recording mode
- Synchronizing with other devices
- Viewing input levels
- Inserting markers while recording
- Configuring gap detection
- Automatically labeling windows and regions
- Changing blinking status
- Extracting audio from CDs
- Burning CDs
- Proper use of software
- Recording audio
- Editing, Repairing, and Synthesizing Audio
- Processing Audio
- Applying Effects
- Adding an effect
- Adding a chain of effects
- Applying effects using the Plug-In Chainer
- Adding plug-ins to a chain
- Selecting the processing mode for audio tail data
- Arranging plug-ins on a chain
- Bypassing effects
- Removing plug-ins from a chain
- Configuring chained plug-ins
- Saving individual plug-in settings as a custom preset
- Saving plug-in chains
- Loading plug-in chains
- Managing effects
- Automating Effect Parameters
- Adjusting envelopes
- Using Acoustic Mirror and Wave Hammer
- Working with MIDI/SMPTE
- Sampling
- Looping
- Working with Video
- Using Spectrum Analysis
- Working in the frequency domain
- Using a spectrum graph
- Displaying a spectrum graph
- Monitoring an input and output source
- Displaying frequency and amplitude values, notes and statistics
- Navigating a spectrum graph
- Changing the graph type
- Changing the zoom level
- Working with stereo files
- Updating a spectrum graph
- Viewing multiple spectrum graphs
- Creating and comparing snapshots of the Spectrum Analysis window
- Printing the graph
- Using a sonogram
- Adjusting Spectrum Analysis settings
- Shortcuts
- Microsoft Audio Compression Manager
- SMPTE Timecode
- Using CSOUND, MTU, IRCAM, BICSF, and EBICSF Files
- Index
252
USING SPECTRUM ANALYSIS CHP. 17
Right-click the sonogram and choose Show Position from the shortcut menu to toggle the display of
ToolTips. The setting for each sonogram in a stereo file is independent.
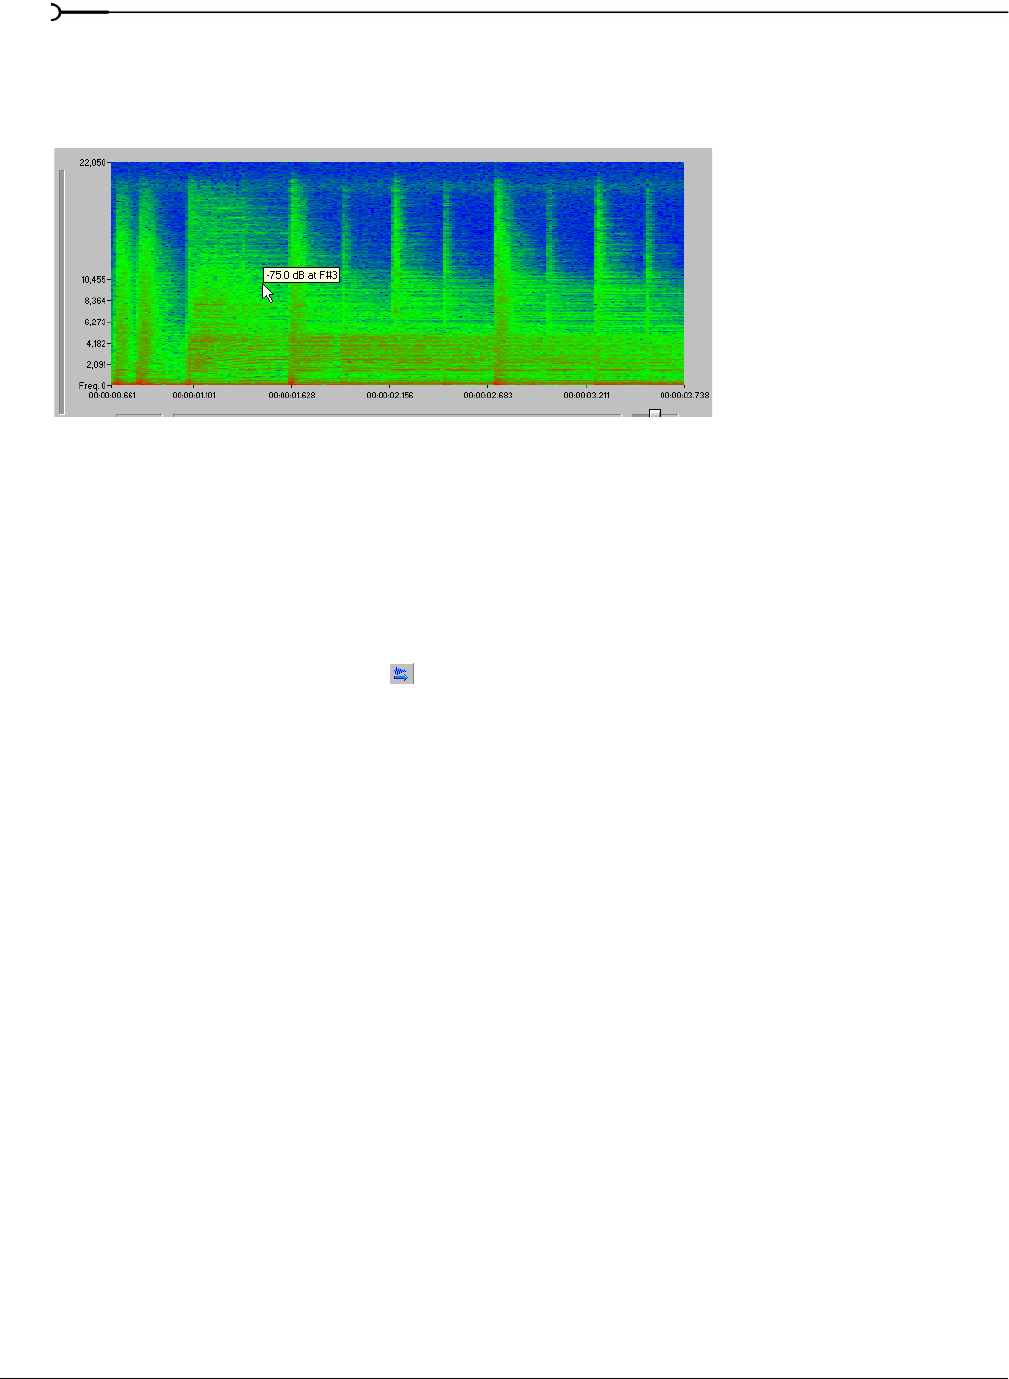
If you want to display the nearest musical note equivalent of the cursor position in a ToolTip, right-click the
sonogram and choose
Show Notes from the shortcut menu:
Right-click the Spectrum Analysis window and choose Show Statistics from the shortcut menu to toggle the
display of the Statistics area at the bottom of the Spectrum Analysis window.
Updating a sonogram
A sonogram updates in the same method as a spectrum graph. For more information, see Updating a spectrum
graph on page 249.
Monitoring an input and output source
Click the Real Time Monitoring button ( ) to turn real-time spectrum analysis on or off. Click the down
arrow next to the button and choose
Monitor: Input to monitor the device selected in the Record drop-down
list on the Wave tab of the Preferences dialog (to access the Preferences dialog, choose
Preferences from the
Options menu).
Real-time output monitoring is not available in sonogram display mode. When you click the down arrow
next to the button and choose
Monitor: Output from the menu, a cursor is displayed in the sonogram to
indicate the play position.
Tuning a sonogram
It is frequently necessary to experiment with the control parameters in the Spectrum Settings dialog to
produce the best possible sonogram. For more information, see Adjusting Spectrum Analysis settings on page 253.
Improving the graph’s contrast
To improve the contrast of the sonogram, decrease the frequency and amplitude ranges as much as possible.
Smoothing the graph’s display
If the graph appears too pixelated, raise the Set sonogram resolution value to 200.
Improving the frequency resolution
For greater frequency resolution, choose a higher value from the FFT size drop-down list.
Reducing the processing time
To reduce processing time, decrease the Set sonogram resolution value and/or choose a lower value from the
FFT size drop-down list.
Use the cursor to display
musical note equivalent