OPERATION MANUAL 840052 SOFTWARE for Sper Scientific Meters
I N D E X Page Introduction Introduction 1 1 Features 2 Software Installation 3 Main Screen Example : Psychrometer 4 a) Block Description b) Alarm HI/LOW Setting Start Recording 5 Retrieve File 6 Save File 7 Com.
INTRODUCTION: Thank you for purchasing the RS232 software which is used for the following products to on-line logging data to PC for further analysis. a) K.J.T or K.J.T.R.S.E.type Thermometer. b) pH /mV meter. c) Hygro-thermometer & Psychrometer d) Digital Sound Level Meter. e) Anemometer. f ) Manometer. g) Conductivity meter. h) IR Psychrometer i) D.O. Meter Or more Hand Held meters with RS232 interface feature. This software is user-freindly to meet your maximum satisfaction.
THE PACKAGE IS SUPPLIED WITH: 1) A CD ROM. 2) RS232 cable with D-sub connector. 3) Operation manual. Hardware requirement: Windows 98/2000/NT/XP operation system with COM1 to COM4 serial ports. Installation procedure : 1. Connect the socket of RS232 to COM port. 2. Insert CD-ROM to the computer for starting software set up. 3. See the diagram as an example of RS232 Software for your Hand held meter.
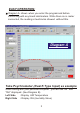
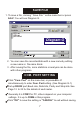
EASY OPERATION: Diagram A shows when you enter the program and before connecting with any Hand Held meters. While there is no meter connected, the reading in two blocks showed without title. Diagram A Take Psychrometer (Dual K Type Input) as example While linking with your personal computer , you will see "Air" and "RH" displayed.
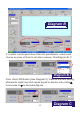
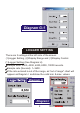
Diagram B If a meter could export more than two parameters, users could choose any two of them to set alarm values.( See Diagram B-1) Diagram B-1 Click Alarm SW button (See Diagram C) to active the limit setting, afterwards, High/ low limit can be keyed in directly or by clicking to increase or to decrease figures.
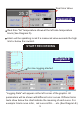
Real time Value Diagram D Real time "Air" temperature shows at the left side temperature block (See Diagram D). Alarm will be sparkling in red if a measured value exceeds the high limit or below the low limit. START RECORDING Diagram E On-line logging started Press START button to active the recording. When starting, the text "Logging Data" will appear on the left corner of the graphic. All parameters will be shown with different color curves.
RETRIEVE FILE Retrieve File Diagram F TO OPEN A FILE 1. Clicking " Retrieve File" on the tool bar or press Alt+R. You will see Diagram F-1. 2. Double-click the folder that contains the document you want to open. Click the document name, and then click OK. 3. All documents are saved as *.txt file types, no other files type are valid.
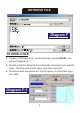
SAVE FILE 1. To save a file, clicking " Save File " on the menu bar or press Alt+F.You will see Diagram G. Look in: 8711.txt 8721.txt ph1116.txt Diagram G File name: File of type: 2. You can save the recorded data with a new name by editing a new name in file name block. 3. After saving the file, more statistics or analysis can be done with other programs. COM. PORT SETTING Click "Com. Port" on the menu bar, or press Alt + C simultaneously to enter Com. Port setting.
Diagram G-1 LOGGER SETTING There are 3 settings at the left side of the screen: (1)Logger Setting, (2)Dispaly Range and (3)Display Control. (1)Logger Setting (See Diagram H) Sample data: 2000, 4000, 6000, 8000, 10000 records. Sample rate (Second): 1~3600. If the rate entered is out of the range, an "out of range" chart will appear as Diagram I and show the valid min. & max. values.
(2)Display Range (See Diagram J) There are 5 ranges: 0.5K(500), 1K, 2K, 5K, 10K for setting the division of the number of reading records shows on the screen. FOR EXAMPLE : If the screen shows display range indicator on "0.5K". The screen will be showing from 0000 to 0499f for a total 500 records.
Diagram L If select "Y OFF" as "-5" and "Y GAIN" as "50", Y range will show from "-250", -200, -150, -100, -50, 0, 50, 100,150, 200 and rated by "50" basis. (See Diagram M ).
Y GAINS/DIV There are 7 ranges : 1, 2, 5, 10, 50, 100, 200, for setting the division of the start reading value. (See Diagram N) Diagram N FOR EXAMPLE: If select "Y OFF" as "0" and "Y GAIN" as "100", Y range will show from 0,100, 200, 300, 400, 500, 600......1000 rated by 100 basis.
There are different screens show on the next few pages for the examples of different parameters be monitored . MANOMETER Pressure value is shown in the left block of the screen, the right block shows Undefined title with no reading. (See Diagram P) For Differential pressure data logging function, the reading is shown at the same block in the left. The meter's unit can be easily changed. There are 11 units for selection, the unit shows on the software is preselected by the meter. .
pH / mV METER The screen shows pH value or mV value in the left side block Temperature value is shown at the right side block (See Diagram Q, Q-1 ) FORMAT: Baud Rate : 2,400 bit /sec. Data Bits : 8 Stop Bit : 1 pXX.XX:tXXX.XC(F) or mXXX.XmV:tXXXX.
SOUND LEVEL METER The screen shows Sound Level value in the left block , "dB" unit is shown by the value , "Undefined " title at the right side of block display with no value. ( See Diagram R ) FORMAT: Baud Rate : 2,400 bit /sec. Data Bits : 8 Stop Bit : 1 N:XXX.
HYGRO-THERMOMETER Temperature value (oC or oF ) is shown in the left block. Relative Humidity ( % ) is shown in the right block. While meter is changing the unit, the software displayed unit will be changed as well. Recommend to reset the Display Control at the same time, or you will see a minor chart change on the screen. (See Diagram S) FORMAT: Baud Rate :1,200 bit /sec. Data Bits : 7 Stop Bit : 1 TXXX.XC(F):HXX.
K.J.T. TYPE & K.J.T.R.S.E. DUAL INPUT THERMOMETER The screen shows T1 temperature value in the left block and T2 temperature is shown in the right block. The meter unit can be easily changed the unit at your disposal, If the meter is set in oC, the data logging will show in oC. Once you change the meter unit to oF, the screen unit will be changed to oF simultaneouly. Recommend to reset the Display range at the same time, or you will see a minor chart change on the screen.
K.J.T. & K.J.T.R.S.E. TYPE SINGLE INPUT THERMOMETER T1 Temperature value is shown in the left block. No reading is shown in the right block. The meter unit can be easily changed at your disposal, If the meter unit is set in oC , the reading will show in oC. Once you change the meter unit to oF ,the screen unit will be changed to oF simultaneouly. Recommend to reset the Display Control range at the same time, or you will see a minor chart change on the screen.
ANEMOMETER T1 Temperature value is in the left block. Air Flow (FTM, MPS) is shown in the right block. The meter unit can be easily changed at your disposal, if the meter unit sets in oC , the value will shown with oC. Once you change the meter unit to oF , the screen unit will be changed to oF simultaneouly. Recommend to reset the Display Control at the same time, or you will see a minor chart change on the screen. (See Diagram V) The same condition applied to change the unit between FPM and MPS .
DISSOLVED OXYGEN There are 5 parameters could be selected on the screen: 2 DO values ( related and absolute), Temperature, Pressure and Salinity. If select DO (%) in left block, the right block will be DO (mg/L) or others. The meter unit can be easily changed at your disposal, if the meter unit sets in oC , the data logging is shown with oC. Once you change the meter unit to oF, the screen unit will be changed to oF simultaneouly.
ANEMO-PSYCHROMETER Total 6 or 7 parameters could be displayed on the monitor: Velocity, Temperature, RH, DP, WET, VOL & BTU (or no BTU) If the Velocity ( V) is in the left block, the right block will be others. The meter unit can be easily changed at your disposal, if the meter unit sets in oC , the data logging value is shown with oC. Once you change the meter unit to oF, the screen unit will be changed to oF simultaneouly.
IR PSYCHROMETER Total 5 parameters could be displayed on the monitor: Air temp., IR temp., RH, WET and DP. If the RH is in the right block, the left block will be others. The meter unit can be easily changed at your disposal, if the meter unit sets in oC , the data logging value is shown with oC. Once you change the meter unit to oF, the screen unit will be changed to oF simultaneouly. Recommend to reset the Display Control at the same time, or you will see a minor chart change on the screen.
PSYCHROMETER Total 6 parameters could be displayed on the monitor: Air temp., 1 or 2 external temp., RH, WET and DP. If the RH is in the right block, the left block will be others. The meter unit can be easily changed at your disposal, if the meter unit sets in oC , the data logging value is shown with oC. Once you change the meter unit to oF, the screen unit will be changed to oF simultaneouly. Recommend to reset the Display Control at the same time, or you will see a minor chart change on the screen.
STATISTICS Click "Statistics" on the menu bar or press Alt + T simultaneously to see statistics in histogram format 1 2 3 4 5 6 7 8 9 10 On the left up corner, you could choose which parameter you want to see its statical data. The division of data can be set up from 4 divisions to 20 divisions. Histogram will be automatically changed once you re-set interval. Maximum, Minimum , Mean and Std. Dev (Standard Deviation) are automatically calculated and shown on the right side of the screen.
PRINT GRAPH To change printers and printing options: To click Print Graph on the tool bar. Or press Alt + P on the keyboard. To change printers. Click Properties, then select a printer in name. To change paper specifications. Select the settings you want in Graphics Options.