Operations Manual SDS Data Logger MODEL SDS 8020/8040 Universal Data Logger Please read, understand, and follow these instructions before operating this equipment. Super Systems, Inc. is not responsible for damages incurred due to a failure to comply with these instructions. If at any time there are questions regarding the proper use of this data logger, please contact us at (800) 666-4330 for assistance. 7205 Edington Drive Cincinnati, OH 45249 513-772-0060 / 800-666-4330 Fax: 513-772-9466 www.
Table of Contents Product Overview _____________________________________________________________________________ 5 Product Description ________________________________________________________________________ 5 Product Specifications ______________________________________________________________________ 5 Software Installation _______________________________________________________________________ 6 Calibration _______________________________________________________________________________ 6 Getting Started
To Perform a Cold Junction Calibration____________________________________________________ 34 24. System Setup ________________________________________________________________________ 35 25. Set Pass Codes ______________________________________________________________________ 36 26. Set IP Address _______________________________________________________________________ 36 32. Survey Deviation Alarm Log ___________________________________________________________ 37 34.
SDS Reporter Versions 1.101.0.
Product Overview Product Description You’ll find all the necessary information related to how to use the product in this manual. The product is broken up into 2 parts, the software and hardware components. This user guide is also written in this manor. SDS8020 / SDS8040 provides the hardware and software needed to meet industry standards for thermocouple uniformity by logging and generating temperature and data log reports.
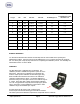
Degrees F. A/D Accuracy Accuracy Accuracy TC Type Min Max Full scale Full Scale At 1600 Degrees F. At 1600 Degrees F with thermister error B 32 3308 0.0124% 0.0179% 0.29 0.65 C 32 4208 0.0062% 0.0067% 0.11 0.47 E -328 1832 0.0031% 0.0032% 0.05 0.41 J -346 2192 0.0031% 0.0036% 0.06 0.42 K -328 2502 0.0031% 0.0045% 0.07 0.43 N -328 2372 0.0031% 0.0052% 0.08 0.44 NNM 0 1409 0.0031% 0.0033% 0.05 0.41 R -58 3214 0.0062% 0.0118% 0.19 0.
Getting Started When logging data, the operator will use the on-board display to start and stop the data logging / survey process. The first steps related to data logging are connecting the inputs to the terminal strips on the data logger. Each terminal strip represents a single analog board with 5 inputs. You can remove these terminal strips by pulling up on both ends of the terminal strip. Depending on the model number, you have either 20 or 40 input channels for data logging.
Survey Templates The data logger will default to the last survey template used. To modify the template being used, the operator can go to the Select Survey Template menu option. This data will be carried over for the reporting process to make the reporting quick and easy. On the Survey Template screen there are parameters that can be modified for a specific survey such as setpoint. After setting the required parameters, the start survey process can be selected.
The report templates are user defined and should be configured to meet your needs. All reports can be saved and displayed at a later date. Super Systems Inc.
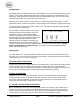
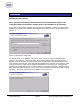
Installation Installing the SDS Software Note – The person installing the SDS Software must have administrative rights on the computer(s) where the installation is taking place for the installation to be successful. Double-click on the setup file, SDSSetup.msi to start the auto-installation. If there is no version of the SDS Reporter running on the computer, the installation will prompt the user for the download location (figure 1.1). Figure 1.
Figure 1.2 Installation ready screen Clicking on the “Cancel” button will prompt the user to confirm exiting the setup without continuing. Clicking on the “< Back” button will display the previous page, which is the installation setup page (figure 1.1). Clicking on the “Next >” button will install the software to the specified location. Once the software has been installed, the installer can be closed. The SDS Reporter software will now be ready to use.
Ethernet computers without a hub. An Ethernet crossover cable has it's send and receive wires crossed. When using a hub or switch, this is automatically done for you. With a crossover cable, you are forming a network between the computer that you are directly plugged into and the data logger. There will be some network settings on the computer that you will have to configure for the 2 devices to communicate. The data logger will have the network setting already setup with the following IP address – 192.168.
SDS 8020/8040 Data Logger Menu List The menu list shows the available pages displayed six at a time. To access the list, press the Esc key. Depending upon where you are starting from, it may require pressing this button more than once. The up (Ï) and down (Ð) arrows are used to scroll through the selections, which are repeated below. To go to a specific page, either type in the page number and press Enter, or use the arrow keys to highlight the selection and press Enter.
20. Set the Date and Time 21. Port Setup 22. Input Calibration 23. Cold Junction Trim 24. System Setup Configuration Level – Level 2 Pass Code Required 25. Set Pass Codes 26. Set IP Address Menu Pages 27, 28 and 29 are reserved for future use and do not exist at this time. To minimize the possibility of unintended modifications to the instrument, certain menu pages will require the entry of a pass code to access them.
Date and Time Quick Reference Chart Code Month January 1 Day Sunday Code 0 Code Hour Code 12 am 0 12 pm 12 1 1 1 13 February 2 Monday March 3 Tuesday 2 2 2 2 14 April 4 Wednesday 3 3 3 3 15 May 5 Thursday 4 4 4 4 16 June 6 Friday 5 5 5 5 17 July 7 Saturday 6 6 6 6 18 7 7 7 19 8 8 8 20 9 9 9 21 August September October 1 Hour 8 9 10 November 11 10 10 10 22 December 12 11 11 11 23 Super Systems Inc.
Keypad Assignments All of the functions of the SDS Data Logger are controlled from the keypad. The functions of each button are as follows: 0 – 9 are used to enter numeric data that can vary with each page “.” Is used to enter a decimal point where necessary for data entry Enter is used when entering numeric data from the keypad or initiating automatic functions Ï and Ð are used to navigate through the menu options or scroll through data on a specific page ESC is the escape key.
1. Overview Display The Overview Display shows the current readings of the five thermocouples on all four or eight boards, depending on the number of channels. Pressing the circular arrow key will display the Quick Chart screen (menu option 16). Pressing the up or down arrow keys will display the Modify Input Offsets screen (menu option 9). Pressing any of the number keys (1-9) will display the corresponding menu option. 2.
To stop a survey, highlight the Action field, enter a 0 and then press Enter. Once the survey has finished, “Finished” will appear in the highlighted area and the stop Date/Time will be filled in the “Stopped at” field. To change the Setpoint, highlight the Setpoint field, enter in the new Setpoint and press Enter. Pressing the circular arrow key while the setpoint field is highlighted will change the sign of the value entered.
4. Display Input Offsets The Display Input Offsets screen displays the offsets for all five thermocouples on all four /eight boards, depending on the SDS type. Pressing the down arrow key will display the Modify Input Offsets screen (menu option 9). Pressing any of the number keys (1-9) will display the corresponding menu option. 5. Display Logged Data The Display Logged Data shows the logged data from a specific date, with the default setting being the current hour of the current date.
The first screen will display the first five inputs and the first ten minutes of data. Pressing the circular arrow button will allow the user to scroll through the inputs, five inputs at a time. Pressing the down arrow button will show the next ten minutes of logged data. Pressing the up arrow will show the previous ten minutes of logged data. Pressing the ESC key will display the Display Logged Data Screen. 6.
turn a thermocouple off as well. Pressing the circular arrow key will display the Overview Display Selected screen (menu option 17). Pressing the ESC key will also display the Overview Display Selected screen. 8. Modify Input Settings The Modify Input Settings allows the user to select a channel (input) and manually set the range/type, or set the range/type for all of the channels. To select a channel, highlight the area and then enter a number from 1 to 40 corresponding to the specific channel.
9. Modify Input Offsets The Modify Input Offsets screen allows the user to modify the offsets of each channel, or to clear all of the offsets. To select a channel, highlight the “Select Input” line and enter a number between 1 and 40. To enter the offset value, highlight the “Enter offset value” line and enter a number between –1000 and 1000. The user can toggle the sign (+/-) of the number being entered by pressing the circular arrow button.
11. Battery Status This page displays information about the instrument’s power supply. Battery Voltage: This displays the DC voltage from the battery. It will read higher when the instrument is plugged in, so a true measurement should be taken when it is not connected to AC power. Battery Condition: This will display the battery status as Very Low, Low, or OK depending on the battery voltage. When the instrument is plugged in, this will display Charging.
12. About/Sign-On The above screen is the sign-on screen that shows the SSi logo, address, and phone. This page will also display the instrument model and serial number, the date of the last factory calibration, and the number of hours and minutes the instrument has been in use since the last factory calibration. Pressing the down arrow key will display the Revision Display screen (menu option 13). 13. Revision Display This screen displays the firmware revision levels for the instrument.
14. Set Display Values This screen is used to adjust the display values. The backlight brightness and contrast are factory set to 40% and 50%, respectively, which is appropriate for most viewing conditions. Pressing the circular arrow key will return these values to their default settings. The values for brightness and contrast can range from 0 (dark) to 100 (bright). The backlight ON time is a power-saving feature that extends battery life.
16. Quick Chart This screen displays a trend chart for one active thermocouple over a period of ninety minutes. The information on the right displays the active thermocouple number (TC), the temperature of that thermocouple, the Setpoint (SP), the maximum value (Max) and the minimum value (Min). The information on the left of the screen displays the full-scale value and the middle value as reference points. Pressing the up or down arrow keys will display the Quick Chart Setup screen (menu option 18).
18. Quick Chart Setup This screen displays the setup information for the Quick Chart. Valid values for the setup information are: Survey Setpoint: 0 through 9999 TC input to chart: 1 through 40 Chart full scale: 0 through 9999 Chart zero scale: 0 through 9999 Reset min/max 1 = yes: 0 or 1 To change a value, highlight the desired value to change, enter in the new value and then press Enter. Pressing the circular arrow key or the ESC key will display the Quick Chart screen (menu option 16). 19.
To change any of these values, use the up or down arrow keys to highlight the field that is to be changed, enter the new value, and press Enter. Valid values are: Setpoint: -400 through 4000 TC Units: 0 for Fahrenheit and 1 for Celsius TC Spool Correction: -100 through 100 For the Setpoint and the Spool Correction, the user can change the sign of the value by pressing the circular arrow key. Pressing ESC will display the Display Survey Information screen (menu option 2). 20.
21. Port Setup This screen displays the parameters used for the communications ports. The factory default settings should not need to be changed by the operator. To change the values that are not “Modbus fixed”, press the circular arrow key to cycle through the available values. Pressing Enter will set the value as the lowest value. 22. Input Calibration This screen displays information to setup the calibration of the inputs.
The top of the screen displays the codes for the ranges. The codes are: 0 – 20MV 1 – 40MV 2 – 80MV 3 – 160MV 4 – 1.28V 5 – 2.56V Below is a listing of the suggested ranges for the various TC types. TC Type mV Range Chart TC Type Range in mV B 20 C 40 E 80 J 80 K 80 N 80 NNM 80 R 40 S 20 T 20 To select a board to calibrate, highlight the first line (“Board number to cal (1 to 8)”), enter the desired board number that will be calibrated, then press Enter.
be calibrated. To select the TCs to calibrate, enter a number between 0 and 31. To determine the number, follow these steps: TC1 has a “value” of 1, TC2 has a “value” of 2, TC3 has a “value” of 4, TC4 has a “value” of 8, and TC5 has a “value” of 16. A TC that is on has a value of 1. A TC that is off has a value of 0. Multiply the TC’s value by its “value” and add all 5 TC values up. For example, we wish to calibrate TC1, TC4, and TC5.
Firmware revision 1.09 or below This screen displays the setup information to trim the cold junction value of each board. Highlight the first line (“Select board number”), enter the desired board number to trim, then press the Enter key. The acceptable values for the board number are: 1 – 8. Any number entered over 8 will default to 8 and any number entered less than 1 will default to 1. Press the down arrow key to highlight the next line (“Clear trims, 1 = yes”).
Firmware Revision 1.10 and above Depending on the revision level of the internal input board, the screen will resemble one of the two following screens. One version uses one Cold Junction Trim value that is applied to the entire board. The other version uses a unique Cold Junction Trim value for each of the five inputs on that board. The instrument will automatically determine which screen should be displayed based on the internal boards that are installed inside it. Input Board Version 1.
are listed from top to bottom starting with input five and ending with input one (except for input three). Enter the desired trim value, and, if necessary, press the circular arrow key to toggle the sign of the trim value. Press the Enter key to set the new trim value. Note – The overall Cold Junction value, as well as any trim value, is modified by adding or subtracting a value to the current value. Input Board Version 1.
equipment normally operates at 1700 °F, then perform the cold junction calibration using a 1700 °F signal. Firmware Version 1.09 and below The user can source temperature to any one of the inputs, since the cold junction value is separate from the input trim values, even though there is only one thermister per board. If the temperature being sourced does not match the temperature displayed on the screen, the user will need to adjust the cold junction value (“Modify brd CJ by (+/-) line) to match.
25. Set Pass Codes This screen allows the user to set the pass codes to access the higher-level functions on the SDS. Menu options 20 through 24 are considered Supervisor Level and they require a Level 1 pass code. Menu options 25 and 26 are considered Configuration Level and they require a Level 2 pass code. The default pass code for Level 1 is 1 and the default pass code for Level 2 is 2. There are 3 pass codes currently on the SDS (there is no pass code for operator-level functions).
32. Survey Deviation Alarm Log The survey deviation alarm log will log all instances where the temperature of one of the survey channels goes above or below the deviation band. The alarm log is on a one-minute update, so any alarm would have to be present for more than a minute to be logged. The start and stop time of the alarm is listed at the top of the screen on the line “AL 1 Start at”. The screen will display the each channel and which channel was high or low.
Options → After Downloading → Delete datalog files from SDS menu option will delete the data log files from the SDS after they have been downloaded to the local computer. Note: Once the datalog files have been downloaded to the local computer, they will not be automatically deleted by the SDS Reporter software. The only way to delete those datalog files will be to delete them manually. Note – With firmware version 1.
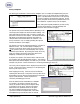
SDS Software SDS Reporter Figure 2.1 SDS Reporter initial screen When the SDS Reporter software is started up, the user sees the above screen.(figure 2.1). The four menu options to choose from are: File, SDS, Options and Help. There are four buttons to choose from: New , Open , Save , and Print . File Menu Options File Æ New / New Button The New option allows the user to create a new report that will include the report properties, the trend chart, and the TC data (figure 2.2).
Figure 2.2 Report Properties Tab File Æ Open / Open Button The Open menu option will allow the user to choose an existing report from a common Windows Open dialog box. The software will open the dialog box in the “SDSReports” folder (typically C:\SSi\SDS\SDSReports) for existing reports (.SDSReport) to open. The Report Properties tab contains several tabs, which in turn contain the information that makes up the report. The first tab is the Report tab (figure 2.
Figure 2.3 Report Properties Report tab , next to the “Data” field will display a screen from which the user can Clicking on the open box, select the interval time (ten seconds, twenty seconds, thirty seconds, one minute, two minutes, or five minutes) and also the specific survey to use (figure 2.4). This screen will only display survey data that has already been downloaded (SDS → Download Surveys and Data). Figure 2.4 Load Survey Data screen The default interval is one minute.
report and the “Survey Results (Pass/Fail)” field is for the results of the survey. The “Notes” field is for any general notes for the report. Manually Creating a Survey Record Clicking on the “Advanced: Manually Create Survey Record” link from the Load Survey Data screen will allow the user to create a survey record to use. Clicking on this link will display the “Manually Create Survey Record” form (figure 2.5).
Figure 2.7 Survey start/end date error message Enter the TC spool offset and click on the “Add Record” button to add the record. Clicking on the “Cancel” button will cancel the add process and bring the user back to the “Load Survey Data” dialog box. If the add was successful, a message box will be displayed (figure 2.8). Figure 2.8 Record Add successful message The added record will be displayed chronologically in the top of the list. Any record manually added will begin with “[Manual Entry]” (figure 2.
Figure 2.10 Report Properties Thermocouples Tab Figure 2.11 Spool Correction screen All values displayed to the users are corrected. That means if there is a defined offset for the TC Spool and a channel offset, the user would be shown the net result of those offsets into the value displayed. There are checkboxes for a possible forty thermocouples, but only the active thermocouples will have checks in the checkboxes.
Figure 2.12 Define Control TC screen Clicking on the Accept button will set the selected control TC(s). Once a control TC(s) has been selected, the TC’s number will be in Red on the “Active Thermocouples” section of the Thermocouples tab. The thermocouple(s) that is identified as the control TC will not be used for the TC summary when identifying hottest and coldest channels. Clicking on the “View Offsets used in Survey” link will display a list of the offsets that were used on the survey (figure 2.13).
Note: Checking or unchecking TCs on the Thermocouples Tab will affect the TCs plotted on the Chart Tab. The next tab is the Furnace tab (figure 2.14a and 2.14b), which contains the furnace ID, the make and model of the furnace, the furnace type, the furnace use, the furnace’s operating range, the furnace dimensions, the furnace class (newer versions only), and an optional image of the furnace. Figure 2.14a Report Properties Furnace Tab (Version 1.101.0.76 & below) Figure 2.
Clicking on the open box next the image frame will open a dialog box where the user can search for an image of the furnace to use. The next tab is the Survey Box tab, which contains information about the survey box itself, such as the make and model, the serial number, whom the survey box was calibrated by, and the calibration date (figure 2.15). Figure 2.15 Report Properties Survey Box Tab The next tab is the Survey Details Tab (figure 2.16).
The next tab is the Survey Parameters Tab (figure 2.17). The Survey Parameters tab contains: the survey tolerance, the survey setpoint, the overtemp setpoint, the simulated load in pounds, and the microns. Figure 2.17 Report Properties Survey Parameters Tab The next tab is the Controller Tab (figure 2.18a and 2.18b).
Figure 2.18b Report Properties Controller Tab (Version 1.101.0.80 & above) The last tab in the Report Properties tab is the User Defined Tab (figure 2.19a and 2.19b). This tab contains ten (version 1.101.0.76 & below) or twenty (version 1.101.0.80 & above) fields that can be defined by the user and included in the report. Figure 2.19a Report Properties User Defined Tab (Version 1.101.0.76 & below) Super Systems Inc.
Figure 2.19b Report Properties User Defined Tab (Version 1.101.0.80 & above) To create a user defined field, click on the “Modify User Defined Fields”. This will display a screen that will allow the user to edit the fields (figure 2.20). The user can type in the name or description of the field and click the “Save” button. Figure 2.20 Edit User Defined Fields screen Super Systems Inc.
The Chart Tab (figure 2.21) contains the charted information from the time specified on the survey. This tab is similar in design and function to the Real-Time chart (figure 2.40). When the chart tab is active, the chart toolbar buttons also appear and these buttons can be used to zoom in on a section of the chart, pan the chart up, down, left or right, and refresh the chart back to its original values.
Clicking on the “Round this data off to the nearest degree” link will pop up a message box confirming the action (figure 2.24). The rounding only affects imported data. The data in the logged files will still contain data rounded to one decimal place. Clicking on the “Yes” button will round the data. Figure 2.24 Round data confirmation File Æ Save / File Æ Save As / Save Button This will save any changes made to a new or existing report.
The Print Report menu option will allow the user to print out a copy of the .SDSReport file. The user will have to select the printer to print the report (figure 2.26). Figure 2.26 Print prompt screen The Print Survey TC Data menu option will print out a copy of the TC data (as seen on the Data tab). The user will have the option to configure the page settings and select a printer to print to (figure 2.26a). Figure 2.
Print Button When the user clicks on the Print button, the software will display the print preview screen, which is similar in design and function to the print preview screen on the View Real-time chart (figure 2.41 or figure 2.27 below). File Æ Print Preview The print preview screen is similar in design and function to the print preview screen on the View Realtime chart (figure 2.41) and is displayed here (figure 2.27).
SDS Æ Download Surveys and Data The Download Surveys and Data menu option will allow the user to download surveys from a specific SDS instrument. When the menu option is clicked, the SDS software will begin to search for any and all dataloggers located on the network (figure 2.29). Figure 2.29 SDS80XX Data log Extractor screen Any datalogger found on the network will be added to the drop-down list at the top of the screen.
The After Downloading option will allow the user to delete the data files from the SDS instrument, or keep them on the instrument when the files have finished downloading. Choosing the After Downloading → Keep datalog files on SDS menu option will keep the datalog files on the SDS data logger. Choosing the After Downloading → Delete datalog files from SDS will delete the datalog files from the SDS data logger.
Figure 2.34 SDS Data Log Extractor screen The software will display a continuous progress of the download status (figure 2.35). Note: since there may a large number of files to download, this process may take several minutes to complete. Figure 2.35 SDS Data Log Extractor download progress When all of the files have been downloaded, the words “Operation Complete” will be at the bottom of the list, and the button at the bottom will read “Download”.
SDS Æ Launch Direct FTP The Launch Direct FTP tool is used for administrative purposes. If you wanted to clean up old data log files, this tool will allow you to perform this action. Only data stored in the E folder should be manipulated or removed. The Launch Direct FTP menu option will start a new FTP session. This will open a new window that displays all of the files and directories on a specific SDS instrument (figure 2.36). Figure 2.
Figure 2.36a FTP session window with Internet Explorer 7 Figure 2.36b – Open IE7 FTP site with Windows Explorer The version of Internet Explorer can be found in the Help → About Internet Explorer menu option of Internet Explorer. Note: if the SDS Æ Multiple SDS Mode menu option is checked, then the software will display a selection box for the user to select which SDS instrument to FTP into (figure 2.37).
Clicking the “OK” button will open the FTP window. Clicking the “Cancel” button will cancel the FTP session creation. If the Multiple SDS Mode menu option is not checked, the software will start an FTP session with the first SDS device that is found on the network.
SDS Æ View Real-time Data Figure 2.40 Real-time Data screen The View Real-time Data menu option will display the most current real-time data available. This screen will update itself with the most current real-time data every 60 seconds. The amount of time left until the next update will be displayed in the bottom left-hand corner of the screen. When it does update, the software will connect to the SDS, download the data, and re-draw the screen.
highlight the section of the graph that is to be enlarged. Letting go of the mouse button will enlarge the graph. Pan Button This will allow the user to pan to a different part of the graph. Once the cursor is over the graph, it will . By holding down the left mouse button and moving the mouse change to a crosshair with arrows, left, right, up, or down, the user can move the scale of the graph by minutes or temperature, or both.
how many pages to view at once (one, two, three, four or six). The default is one page. The upper right-hand corner of the Print Preview screen contains a page counter, which will allow the user to select which page to preview. Clicking on the “Close” button will close the Print Preview screen without printing the chart. Clicking on the Print button ( ) will print the document. Note: the Zoom function is for preview purposes only and will not affect the actual print size.
Figure 2.43 Confirm delete of local records Figure 2.44 Remote SDS80xx Survey Records Tab The “Remote SDS80XX Survey Records” tab (Figure 2.44) will allow the operator to delete survey records directly from the SDS data logger. The drop-down list at the top of the screen will list all of the SDS data loggers found on the network. Note – the drop-down list may take a few moments to search the network for SDS data loggers.
Figure 2.45 Changes Saved message box SDS Æ Perform Comms Test SDS Æ Perform Comms Test The Perform Comms Test menu option will send out a broadcast over the network to determine if any SDS instruments are located on the network. If an instrument is located on the network, the software will attempt to ping the device. This function will let the user know if communication with an SDS instrument through the SDS Reporter software is possible. When the test has finished, one of three options will happen: 1.
This means that all communications appear to be ok (figure 2.48). Click the “Close” button to close the form. Figure 2.48 Communications ok message on Test Comms dialog box 3. One or more SDS were found, but one or more failed to respond to a ping. SDS instruments were found on the network, but one or more did not respond to a ping.
Figure 2.50a UDP Error Options Menu Options Options Æ Multiple SDS Mode This is a toggle switch for the application. If there are multiple SDS instruments located on the network, click this menu option. Once clicked, there will be a check mark next to the menu item. If this menu option is not checked and there are multiple SDS instruments on the network, the software will use the first SDS device that is found. This menu option is checked by default.
The software will automatically update the files and restart the application (figure 2.53) Figure 2.53 Automatic Update screen If no updates are available, then the software will display a message box informing the user (figure 2.54). Figure 2.54 No updates message box Help Æ About The About menu option displays the SDS Reporter version that is running, and all of the previous versions with any version notes (figure 2.55). Super Systems Inc.
Figure 2.55 SDSReporter About box SDS Data Tags SDS Data tags are created so that all of the template information and survey data can automatically be used for the report process. Data that is captured during the survey is summarized to provide the overall results for the report. This can be in the form of a graph, tabular data, text, etc. Data tags have been specifically created to address the uniformity requirements for AMS and other standards.
TC Survey Summary Temperature Setpoint: °# Minimum TC number: #mtcn# Maximum TC number: #xtcn# Minimum TC Value: #mtcv# Maximum TC Value: #xtcv# Min deviation from setpoint: #md# Max deviation from setpoint: #xd# Figure Output From Data Tags Tag SDS:FILE SDS:PD SDS:PT SDS:FID SDS:FM SDS:FT SDS:FU SDS:FD SDS:FC SDS:FOR SDS:SD SDS:ST SDS:SDR SDS:DUR SDS:OP SDS:APP SDS:TITLE SDS:NOTE SDS:TOL SDS:OTS Super Systems Inc.
SDS:SP SDS:TCN SDS:TCT SDS:TCS SDS:TCC SDS:TCCD SDS:TCCF SDS:SDN SDS:SDSM SDS:SDSS SDS:SDSC Tag SDS:SDSCD SDS:SDSCF SDS:SPEC SDS:INT SDS:T SDS:SIM SDS:OVS SDS:MIC SDS:RES SDS:GRAPH600x400 SDS:COM SDS:UDUR SDS:UTCN SDS:PCT SDS:PDB SDS:POL SDS:PPB SDS:PR SDS:PRE SDS:CMF SDS:CMA SDS:IT SDS:TCG SDS:OV SDS:OD SDS:OVT SDS:CTD SDS:CTN °# SDS:ED SDS:ET SDS:TCM SDS:UD1 SDS:UD2 SDS:UD3 SDS:UD4 SDS:UD5 SDS:UD6 Super Systems Inc.
SDS:UD7 SDS:UD8 SDS:UD9 SDS:UD10 SDS:UD11 SDS:UD12 SDS:UD13 SDS:UD14 SDS:UD15 SDS:UD16 SDS:UD17 SDS:UD18 SDS:UD19 SDS:UD20 Sample Output Tag SDS:FILE SDS:PD SDS:PT Tag SDS:FID SDS:FM SDS:FT SDS:FU SDS:FD SDS:FC SDS:FOR SDS:SD SDS:ST SDS:SDR SDS:DUR SDS:OP SDS:APP SDS:TITLE SDS:NOTE SDS:TOL SDS:OTS SDS:SP SDS:TCN SDS:TCT SDS:TCS SDS:TCC SDS:TCCD SDS:TCCF SDS:SDN SDS:SDSM SDS:SDSS SDS:SDSC SDS:SDSCD SDS:SDSCF SDS:SPEC SDS:INT Super Systems Inc.
SDS:T F SDS:SIM 500 SDS:OVS None SDS:MIC N/A SDS:RES Passed SDS:GRAPH600x400 [An image of the graph] SDS:COM Company Name SDS:UDUR 30 mins SDS:UTCN 20 SDS:PCT 20 SDS:PDB 2 SDS:POL 2 Sample Output Tag SDS:PPB 2 SDS:PR 2 SDS:PRE 2 SDS:CMF Super Systems SDS:CMA 7EK SDS:IT B SDS:TCG 16 SDS:OV Yes SDS:OD TC6 - 1700° SDS:OVT 5:30 SDS:CTD TC5 is the control TC, and is not used in uniformity survey results SDS:CTN TC5 °# °F SDS:ED 2/16/06 SDS:ET 11:30:00 AM SDS:TCM [Thermocouple image] TC Offsets Tag #o1# Descript
#mtav# #mtcv# #mtcx# #md# #rect# #xtcn# #xtan# #xtav# #xtcm# #xtcv# #xd# Tag #n1# #x1# #m1# #s1# #vn1# #vx1# #vm1# #mtcn# #mtan# #mtav# #mtcv# #mtcx# #md# #rect# #xtcn# #xtan# #xtav# #xtcm# #xtcv# #xd# #ts# segment Minimum TC value during approach segment #mtav# Minimum TC value #mtcv# The maximum temperature of the minimum #mtcx# TC Minimum calculated survey TC absolute #md# deviation from setpoint Recovery Time – the time between the time #rect# when the first TC comes into tolerance and the time when th
user would set up any initial formatting settings, such as margin sizes, page layout (portrait or landscape), etc. Now, the user can set up the template to his or her company’s specifications. Suppose that the current date and time will be in the top right corner of the report and should be 10-point Arial font. On the first line, the user can select the right-justified option, the 10-point font size option, and the Arial font option. This will leave the cursor in the top right corner.
Figure 2.57 Actual NewTemplate report Super Systems Inc.
SDS Template Manager SDS Reporter Versions 1.101.0.71 and below The purpose of a template is to save the users time by filling in some of the more generic survey data. For example, the user could create a template for one customer, including company name, TC type, etc; then when the survey is run using this template, this information is already present and it won’t need to be entered for each survey run for that customer. The SDS Template Manager (figure 3.
the New menu option is clicked, the tabs that contain all of the fields for the template will become visible, as well as the Templates list. Creating a new template file will also enable the Save menu option and the Save As menu option. Using the keyboard shortcut Ctrl + N will also create a new set of templates. Open Button / File Î Open The Open button, , or the Open menu option will allow the user to open an existing template file either from the local computer, or from an SDS instrument on the network.
Figure 3.4 SDS Instrument selection box While the SDS software is searching the network for SDS devices, it will display a progress box, which will detail the progress of the search (figure 3.5). Figure 3.5 SDS software progress box When the software is finished searching, the progress box will close automatically. When the Open Button or the Open menu option is clicked, the tabs that contain all of the fields for the template will become visible.
Figure 3.6 Overwrite confirmation If the user types in a filename that does not exist and clicks “Save”, the SDS software will prompt the user for creation confirmation (figure 3.7). Clicking “No” will close the confirmation box without saving and return the user to the Save As dialog box. Clicking “Yes” will save the file. Figure 3.7 Creation of a file confirmation If the user selects an SDS instrument, the SDS software will display a progress box (figure 3.5).
Figure 3.9 Setpoint Not Numeric error message Once a template has been added, the first template will be loaded into the fields. Save Changes to Template Button This option will save the changes made to a specific template back to the template collection stored in memory. A valid template must be selected from the “Templates” list to the right of the “Template Information” tab (figure 3.10). Note: this will only save changes to 1 template at a time and it will not save changes to the template file.
Delete Template Button This option will delete a template from the collection of 32 templates stored in memory. Note: the first template cannot be deleted. If the user attempts to delete the first template, the SDS software will display an error message (figure 3.12). Figure 3.12 Unable to Delete First Template message Once the user clicks on the “Delete Template” Button, the SDS software will display a message confirming the delete (figure 3.13). Figure 3.
Description of Template Manager Screen Tabs Template Information Tab Figure 3.14 Template Information tab This tab contains general information about the template such as the Template Name, the Company Name, the Number of TCs, the TC Type, the TC Spool Number, the TC Spool Correction, the Setpoint, the Simulated Load in pounds, and any Notes about the template. This tab also contains the 3 template buttons: Add New Template, Save Changes to Template, Delete Template.
Survey Information Tab Figure 3.15 Survey Information tab This tab contains information about the survey such as the Survey Duration in minutes, the Survey Tolerance, the Specification the survey meets, the Sample Interval in seconds, and the Operator performing the survey.
Active TCs Tab Figure 3.16 Active TCs Tab This tab contains information about the active TCs such as the type of SDS instrument involved (8020 or 8040), the Gauge of the TC, and a check box for each of the TCs. There is also a check box to allow the user to use the active settings for the TCs or to individually select the TCs to use on the SDS instrument.
Controller Information Tab Figure 3.17 Controller Information Tab This tab contains information about the controllers such as the Controller Manufacturer, and the Controller Make and Model. It also contains information about the PID settings such as the Cycle Time, the Dead Band, the Output Limit, the PB (gain), the Rate, and the Reset. This tab also contains the 3 template buttons: Add New Template, Save Changes to Template, Delete Template. Super Systems Inc.
SDS Reporter Versions 1.101.0.76 and above The purpose of a template is to save the users time by filling in some of the more generic survey data. For example, the user could create a template for one customer, including company name, TC type, etc; then when the survey is run using this template, this information is already present and it won’t need to be entered for each survey run for that customer. The new SDS Template Manager (figure 3.
Figure 3.19 Open template menu option The use will be able to open a local template file or a template file that is on an SDS. If the user selects a local file, the user will be able to click on the Browse button to select the file to open. The SDS software will display a common Windows dialog box for the user to select which file to open. If the user selects an SDS instrument, the SDS Software will display a selection box with all of the available SDS instruments on the network.
when the “Save Template File As” screen is first opened. Clicking on the Scan button will allow the user to re-scan the network for available SDS instruments. Once a local file or remote file has been selected, click on the Save File button to save the file, or click on the Cancel button to close down the screen without saving the file. Figure 3.20 Save Template File As screen The software will always display a message box with the success or failure of the save.
not have to scroll down to see the template on the SDS. The up arrow button will move the template up one position, and the down arrow button will move the template down one position. Description of Template Manager Screen Tabs Template Information Tab Figure 3.
Survey Information Tab Figure 3.22 Survey Information tab This tab contains information about the survey such as the Survey Duration in minutes, the Survey setpoint, The survey Tolerance, the Operator performing the survey, the simulated load, in pounds, and the Specification the survey meets. Super Systems Inc.
Active TCs Tab Figure 3.23 Active TCs Tab This tab contains information about the active TCs such as the number of TCs used, the Gauge of the TC, the TC type, spool serial number, spool correction, and a check box for each of the TCs. There is also a check box to allow the user to use the active settings for the TCs or to individually select the TCs to use on the SDS instrument. Checking “Use these active TC settings” will set the checked TCs. Super Systems Inc.
Controller Information Tab Figure 3.24 Controller Information Tab This tab contains information about the controllers such as the Controller Manufacturer, the Controller Model, and the instrument type. It also contains information about the PID settings such as the Cycle Time, the Dead Band, the Output Limit, the PB (gain), the Rate, and the Reset. Super Systems Inc.
Description of Template Manager Screen Fields This section will describe the Template Manager screen fields and list any constraint for the fields.
TC Spool SN The spool number 18 TC Spool Correction The spool correction factor 8 TC Gauge The gauge of the TCs 2 Use Active TC Use the active TC settings option N/A The active TCs for the survey N/A SDS 8020 instrument option N/A Settings Check box 1 – Check box 40 SDS 8020 (Version 1.101.0.76 & Below) SDS 8040 SDS 8040 instrument option N/A (Version 1.101.0.
• When “40” is typed into the “Number of TCs” field, the SDS 8040 option is automatically selected, and Check boxes 21 through 40 (Boards 5 through 8) are enabled General Notes • Checking “Use these active TC settings” will enable the checkboxes • Unchecking “Use these active TC settings” will disable all 40 check boxes. The TC check boxes will still be checked, but the SDS instrument will not use these settings. Super Systems Inc.
Appendix A – Standard Calibration Range Ranges used for the following thermocouples for certification are listed below unless otherwise specified by the customer. Calibration and certification of the instrument are performed based on customer specifications. For instrument calibration procedures, see section SDS 8020/8040 Data Logger → Keypad Assignments → 22. Input Calibration and section SDS 8020/8040 Data Logger → Keypad Assignments → 23. Cold Junction Trim.
Revision History Rev. Description Date MCO # - Initial Release 06-08-06 N/A A Updated SDS Download option (delete datalog files); Added SDS – Manage Survey Records menu option; Updated Menu Option 34 – Clear Logged Data (delete datalog files); Updated the SDS About screen; Updated the Control TCs screen; Updated Cold Junction menu screen (menu option 23); Added new data tags 01-12-07 N/A B Updated to reflect firmware revision 1.