
Datasheet


Characteristics SM6T
4/9
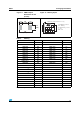
Figure 4. Clamping voltage versus peak pulse current
(a)
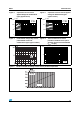
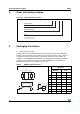
Figure 2. Peak power dissipation versus
initial junction temperature (printed
circuit board)
Figure 3. Peak pulse power versus
exponential pulse duration
a. The curves of Figure 4 are specified for a junction temperature of 25 °C before surge. The given results may be
extrapolated for other junction temperatures by using the formula: ΔV
BR
= αT * [T
amb
-25] * V
BR
(25 °C). For intermediate
voltages, extrapolate the given results.
0
0
20
40
60
80
100
%
20
40 60 80 100 120 140 160 180 200
Tj initial (° C)
t = 20µs
p
t = 1ms
t = 10ms
p
p
Exponential waveform: