
Datasheet

STTH506 Characteristics
3/9
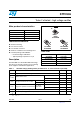
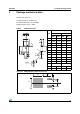
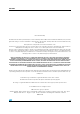
Figure 3. Relative variation of thermal
impedance junction to case versus
pulse duration (TO-220AC, DPAK)
Figure 4. Relative variation of thermal
impedance junction to case versus
pulse duration (TO-220FPAC)
0.0
0.1
0.2
0.3
0.4
0.5
0.6
0.7
0.8
0.9
1.0
1.E-03 1.E-02 1.E-01 1.E+00
Z/R
th(j-c) th(j-c)
t (s)
p
Single pulse
TO-220AC
DPAK
0.0
0.1
0.2
0.3
0.4
0.5
0.6
0.7
0.8
0.9
1.0
1.E-03 1.E-02 1.E-01 1.E+00 1.E+01
Z/R
th(j-c) th(j-c)
t (s)
p
Single pulse
TO-220FPAC
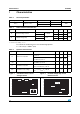
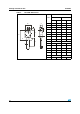
Figure 5. Peak reverse recovery current
versus dI
F
/dt (typical values)
Figure 6. Reverse recovery time versus
dI
F
/dt (typical values)
0
2
4
6
8
10
12
14
0 50 100 150 200 250 300 350 400 450 500
I (A)
RM
dI /dt(A/µs)
F
I =2 x I
FF(AV)
I=I
FF(AV)
I =0.5 x I
FF(AV)
I =0.25 x I
FF(AV)
V =400V
T =125°C
R
j
0
50
100
150
200
250
0 50 100 150 200 250 300 350 400 450 500
t (ns)
rr
dI /dt(A/µs)
F
I =2 x I
FF(AV)
I=I
F F(AV)
I =0.5 x I
FF(AV)
V =400V
T =125°C
R
j
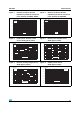
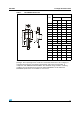
Figure 7. Reverse recovery charges versus
dI
F
/dt (typical values)
Figure 8. Softness factor versus
dI
F
/dt (typical values)
50
100
150
200
250
300
350
0 50 100 150 200 250 300 350 400 450 500
I =2 x I
FF(AV)
I=I
FF(AV)
I =0.5 x I
FF(AV)
V =400V
T =125°C
R
j
dI /dt(A/µs)
F
Q (nC)
rr
0.50
0.75
1.00
1.25
1.50
1.75
2.00
2.25
2.50
0 50 100 150 200 250 300 350 400 450 500
S factor
I = 2 x I
T = 125° C
FF(AV)
j
V = 400 V
R
dI /dt(A/µs)
F