
Datasheet


STTH8R06 Characteristics
3/12
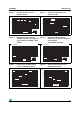
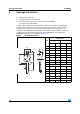
Figure 1. Conduction losses versus
average current
Figure 2. Forward voltage drop versus
forward current
0
2
4
6
8
10
12
14
16
18
20
22
24
0246810
T
δ
=tp/T
tp
δ = 0.2
δ = 1
δ = 0.05
δ = 0.1
δ = 0.5
I (A)
F(AV)
P(W)
0
10
20
30
40
50
60
70
80
90
100
01234567
I (A)
FM
V (V)
FM
T = 25°C
(maximum values)
j
T =125°C
(maximum values)
j
T =125°C
(typical values)
j
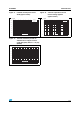
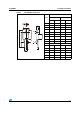
Figure 3. Relative variation of thermal
impedance junction to case versus
pulse duration (TO-220AC, I
2
PAK ,
D
2
PAK )
Figure 4. Relative variation of thermal
impedance junction to case versus
pulse duration
(TO-220FPAC Insulated)
0.0
0.1
0.2
0.3
0.4
0.5
0.6
0.7
0.8
0.9
1.0
1.E-03 1.E-02 1.E-01 1.E+00
T
δ
=tp/T
tp
Z/R
th(j-c) th(j-c)
t (s)
p
Single pulse
0.0
0.1
0.2
0.3
0.4
0.5
0.6
0.7
0.8
0.9
1.0
1.E-03 1.E-02 1.E-01 1.E+00 1.E+01
Z/R
th(j-c) th(j-c)
T
δ
=tp/T
tp
t (s)
p
Single pulse
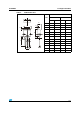
Figure 5. Peak reverse recovery current
versus dI
F
/dt (typical values)
Figure 6. Reverse recovery time versus
dI
F
/dt (typical values)
0
2
4
6
8
10
12
14
16
18
20
22
0 200 400 600 800 1000
I (A)
RM
dI /dt(A/µs)
F
I =2 x I
FF(AV)
I=I
FF(AV)
I =0.5 x I
FF(AV)
I =0.25 x I
FF(AV)
V =400V
T =125°C
R
j
0
10
20
30
40
50
60
70
80
90
100
110
120
0 200 400 600 800 1000
t (ns)
rr
dI /dt(A/µs)
F
V =400V
T =125°C
R
j
I =2 x I
F F(AV)
I=I
FF(AV)
I =0.5 x I
FF(AV)