
Information

To provide a realistic picture of the efficiency in
field manufacturers shall provide any efficiency rating
according to the EU efficiency
3
. The definition of the
weighting of the European efficiency can be seen in
table 2.
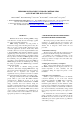
Output
power (%
of rated)
5% 10% 20% 30% 50% 100%
Weighting
factor
3% 6% 13% 10% 48% 20%
Table 2: Definition of EU efficiency
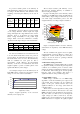
The DC-DC conversion efficiency depends mainly
on the voltage difference between input and output
voltage. The higher the voltage difference the lower the
efficiency. It has to be measured for each nominal
battery voltage individually for all possible input
voltages. Table 3 shows the combinations of battery
output and module input voltages for the measurements.
Battery Measured input voltage levels
12V 30,0V 60,0V 90,0V 120,0V 150,0V
24V 30,0V 60,0V 90,0V 120,0V 150,0V
48V 30,0V 60,0V 90,0V 120,0V 150,0V
Table 3 : Voltage table for measurements
For each test candidate those 15 measurements need
to be done. Each measurement consists of 6 power set
points of table 2. To characterize the efficiency 15 * 6 =
90 measurements need to be done. The EU-efficiency
shall be calculated for each point. To find a
representative overall efficiency the EU-weighted
efficiency of all those 15 measurements have been
weighted equally to provide a realistic picture of the
typical field efficiency of the charger.
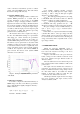
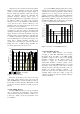
As an example, Graph 1 shows the efficiency for an
input MPP voltage of 60 V and a fix battery (output)
voltage of 12 V of one of the test candidates.
50%
60%
70%
80%
90%
100%
0% 20% 40% 60% 80% 100%
Output Power (% of rated)
Efficiency (%)
Graph 1: Typical dependency of the conversion
efficiency on the output power
The test object reached a peak efficiency 93,3%.
The European weighted efficiency is calculated to
90,9% for the given example.
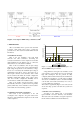
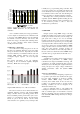
In graph 2 the full picture of the efficiency surface
depending on the MPP input voltage (30 V/60 V/90 V)
and the battery output voltage (12 V/24 V/48 V) can be
seen. Each single measurement point is the EU-
weighted efficiency according to Graph 1 and table 2.
30
60
90
12
24
48
90 %
91 %
92 %
93 %
94 %
95 %
96 %
97 %
98 %
99 %
Efficiency in %
Module input Voltage in V
Battery
voltage
in V
98-99
97-98
96-97
95-96
94-95
93-94
92-93
91-92
90-91
Graph 2: Weighted DC/DC conversion efficiency
characteristics in dependency of the MPP and battery
voltage.
The test candidate from graph 2 shows an equally
weighted DC-DC conversion efficiency of 93,6%. If a
configuration of 90 V module input and 12 V battery
voltage is chosen, the device is operating at DC-DC
conversion efficiency of 91%.
1.4 Thermal de-rating performance
The MPPT charge controller shall be able to handle
its specified nominal power under the given temperature
conditions for a minimum period of 10 hours. Often
chargers are designed to handle the nominal power only
for 30 minutes. After heating up the devices typically
limit the output power (derating). This leads to a
significant reduction of the possible energy yield.
1.5 Static MPPT accuracy
MPPT charge controllers use an MPP-tracking
algorithm to ensure the maximum power output of the
solar module array. Customers can not evaluate the
quality of this pure software function but it has
significant influence to the energy yield which the
controller realizes.
Therefore the test of the algorithm according to EN
50530 has been performed. The first test is the static
MPPT performance. The algorithm has been tested for
all power values (see table 2) and over all input and
output voltages (see table 3) with 10 sec test time.
Similar to the conversion efficiency, also the measured
MPPT efficiencies are weighted. An equally weighted