
Information

result of all these measurements provides a realistic
picture of the static MPPT accuracy. This value reflects
the behavior during a full sunny day.
1.6 Dynamic MPPT accuracy
During days with changing irradiance conditions, the
dynamic MPPT performance is a crucial value. It
provides information on the accuracy of the MPPT
algorithm to adapt to changing irradiation conditions.
This has been measured according to EN 50530 (Annex
B)
1
for all test candidates. Again the algorithm has been
tested for all combinations of input and output voltages
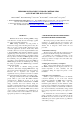
(see table 3) while the input power was ramped up and
down from 0% to 100% with different speed ramp
gradients from 0.1–100 W/(m²*sec).
All measured values where weighted according to
the rules from EN 50530 resulting in a representative
value
η
mpp_dyn
which describes the performance
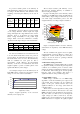
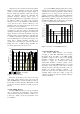
during cloudy days. An example of the results of a
dynamic MPP tracking behaviour can be seen in graph 3.
The unit has very low performance of about 90% while
critically low values of 85%, 80% and 66% can be seen
as well. Such a behaviour leads to a significantly lower
energy yield under slowly as well as rapidly changing
conditions. For comparison, state-of-the-art MPPTs of
grid connected PV inverters reach dynamic MPPT
efficiencies of more than 99%.
Graph 3 : Example of dynamic MPPT performance
– EN 50530.
1.7 Efficiency Calculation
To be able to compare the realistic field efficiency of
MPPT charge controllers a new efficiency performance
factor called Realistic Equally Weigthed efficiency -
REW is defined to:
η
REW
= η
DC-DC
· η
mpp_stat
· η
mpp_dyn
(1)
Formula 1 : Definition of REW.
with
η
DC-DC
Equally weighted DC-DC conversion
efficiency over all possible input and output voltages
according to table 3 using the European weighted
efficiency according to table 2,
η
mpp_stat
The static mpp tracking efficiency according
to EN 50530 while all measured values for different
irradiation conditions are equally weighted and
η
mpp_dyn
dynamic mpp tracking efficiency according
to EN 50530 with ramp gradients from 0.1 – 100
W/(m²*sec) weighted over all power levels from table 2.
The given example shows an REW-efficiency of
η
REW
= η
DC-DC
· η
mpp_stat
· η
mpp_dyn
= 0,9356 · 0,9897 ·
0,8545 = 0,7912.
If this number is compared with standard switching
controllers like shunt or series type charge controllers
which normally operate at about 85% efficiency it can
be seen that the above mentioned device will bring less
energy to the battery than a comparable shunt or series
type charge controller.
2. LABORATORY TESTS
Within the European TESCABI project 9
commercially available MPPT charge controllers have
been tested and measured according to the above
mentioned test procedure.
Samples of all well known solar power electronic
brands coming from all continents around the world
have been purchased through different dealers in
different countries.
The tests itself have been done with the help of the
high sophisticated PV module simulator at AIT as DC
power source
4
.
The output of the test candidate was connected to a
real battery. An electronic load was connected to the
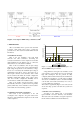
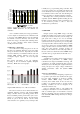
battery to stabilize the batteries voltage. Graph 4 shows
the “Test Stand” which is used within the Austrian
Institute of Technology (AIT) for testing PV grid-
connected inverters. It was used for the tests.
All DC-input and DC-output currents and voltages
have been measured with high accuracy Power
Analysers available at AIT.