
Information

3. TEST RESULTS
All 9 test candidates had to pass the tests described
in chapter 1. The results can be used to compare the
products and to offer customers neutral market relevant
information.
3.1 Installation and usage
Most of the test candidates come with metal
enclosure and solid construction. Concerning the
connection terminal most of the samples showed rather
small terminals and only limited space to connect the
cables. This is not comfortable for installers.
Most of the test candidates offer an input voltage
range up to U
oc
≤ 150 V. Some of the products limit the
input voltage in dependence of the used battery voltage.
In case of a 12 V battery the maximum input voltage is
significantly below 100 V, only for 48 V battery up to
150 V input is allowed. Users should be aware of this
and be careful as this limits the module configuration
flexibility significantly. Higher input voltage ranges
offer more module configuration flexibility and is
recommended as it makes the installation easier.
Most of the samples detected the battery voltage
automatically and had no problem with wrong battery
polarity while many of the candidates could not stand a
solar module short circuit during operation.
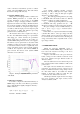
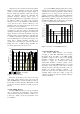
3.2 Nighttime and standby consumption
The result of the measurement of the self
consumption was compared to the given values in the
data sheet of the manufacturer. Graph 5 shows the result
of this comparison.
0
2
4
6
8
10
12
14
16
1 2 3 4 5 6 7 8 9
Test candidate
Standby consumption in W
data sheet in W measurement in W
Graph 5 : Comparison of Nighttime consumption of 9
different MPPT Charge Controllers
A huge difference among the test candidates can be
seen in graph 5. Some samples show not only extremely
high self consumption, but also perform in reality
completely different than indicated by the manufacturer.
An additional consumption of 12 W means 288 Wh/d.
At locations of 4 kWh/(m²*d) this is an additional 80Wp
solar module and 48 V@15 Ah battery more only to
cover the additional consumption.
This results in significantly higher costs for the user and
shows that cheap products can make the system more
expensive.
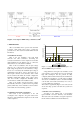
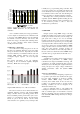
3.3 DC-DC conversion efficiency
According to the defined rule a representative
typical DC-DC conversion efficiency was calculated.
The result of the test candidates was again compared to
the information available from the manufacturers.
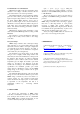
Graph 4 : Test setup for MPPT charge controllers at AIT
4