
Information
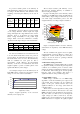
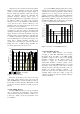

Graph 6 shows the comparison between the realistic
DC-DC conversion efficiency. It has been weighted
equally over all possible input and output voltages on
the base of European efficiency values. The error bar
shows the difference between the maximum and
minimum measured efficiency always given as
European weighted efficiency. Depending on the type of
the efficiency surface (see graph 2) the conversion
efficiency is closer to the maximum possible efficiency
or not. The closer the conversion efficiency to the
minimum of the error bar and the shorter the error bar
the better the conversion efficiency.
Some of the manufacturers state that MPP trackers
can bring up to 30% more energy to the battery than
switching controllers. Even though such a situation can
happen it must be reduced by the DC-DC conversion
efficiency. If the conversion efficiency is only 90% such
a controller could bring in peak times maximum 20%
more but will bring most of the time less energy to the
battery than a standard switching controller as it
operates most of the time in low conversion efficiency.
Taking the losses of MPP tracking algorithm into
account the performance can even be worse.
85
86
87
88
89
90
91
92
93
94
95
96
97
98
99
100
1 2 3 4 5 6 7 8 9
Test candidate
Efficiency in %
Data sheet Mean value
Graph 6 : DC-DC efficiency.
Customers should have a close look to the exact
input-output voltage relation in the real system and
select the MPP charge controller carefully according to
the DC-DC conversion efficiency. Manufacturers shall
provide the conversion efficiency in detail as given in
graph 2.
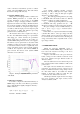
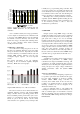
3.4 Static MPPT efficiency
The static MPPT efficiency provides good results in
order to characterize the performance of the inverter
under continuous quasi-static irradiance conditions i.e.:
a sunny day. . Graph 7 shows the performance of the
test candidates.
A good static MPP tracking algorithm never reaches
values below 99%. Graph 7 shows that many of the test
candidates show very low performance, which results in
significant a loss of energy for the customer. As an
example, considering a 3kWp power plant a diminished
MPP efficiency of about 4% results in a direct loss of
approximately 800Wh at a sunny day. This means that
an additional 100Wp solar module needs to be installed
in order to compensate this lack of efficiency.
96%
97%
97%
98%
98%
99%
99%
100%
100%
1 2 3 4 5 6 7 8 9
Test candidate
Static MPPT efficiency in %
Graph 7: Overview on static MPPT efficiency
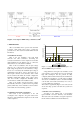
3.5 Dynamic MPPT efficiency
The dynamic MPP efficiency was measured
according to DIN EN 50530:2010 and provides
information about the ability of the MPP tracking
algorithm to adapt to both to slow an fast changing
irradiation conditions. As all off-grid systems are
designed to supply the connected loads during
unfavourable irradiance conditions (winter season,
cloudy days) the dynamic MPPT efficiency is of crucial
importance. A low efficiency result of those executed
dynamic ramp tests is directly proportional to an loss of
efficiency for variable irradiance conditions – in
practice, this can be seen as an additional loss of energy
especially during cloudy days.. Graph 8 shows the
comparison between the static and dynamic efficiency
of the test candidates.