
User manual

Displaying entries numerically (list) and graphically (diagram)
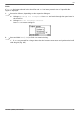
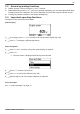
The status display is shown.
1. Press SET.
ð
The main menu is displayed with Yield selected.
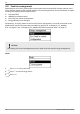
2. Press SET.
ð
The list with yield time periods is shown.
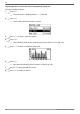
3.
Press rs to select a yield time period.
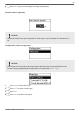
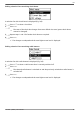
4. Press SET.
ð
The individual yields for the yield time period are shown in a list (Fig. left).
5.
Press rs to select an individual yield value.
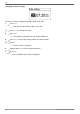
6. Press SET.
ð
The selected individual yield is shown in a chart (Fig. left).
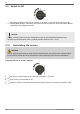
7.
Press rs to page through the charts.
8. Press SET to return to the list.
EN
747.431 | Z09.3 | 2017-09-05
58