
User manual
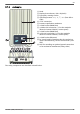

Graphical yield (day, month, year)
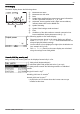
Daily, monthly and annual yields can be displayed graphically in a chart.
①
Period for a single yield value (here: day yield)
②
y-axis:
n Yield in kWh
n With an extra
M
: yield in MWh
n The scaling changes depending on the maximum value.
③
x-axis: time in hours/days/months/years
④
Total of all individual yields shown in the diagram, in kWh
The graphical representation can show annual yields for the last 20
years.
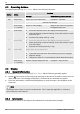
Event messages
See
Ä 7, p. 128
.
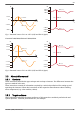
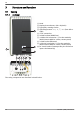
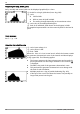
Generator characteristic curve
①
x-axis: input voltage in V
②
y-axis: power in kW
③
Peak = MPP
When the
‘Gen. Ch. Curve’
menu item is called, the inverter records
the generator characteristic curve of the inverter and then displays
it (Fig. upper left). The following applies:
n The inverter traverses the input voltage range and records the
power generated over this range. Duration: a few seconds,
is displayed.
n The MPP is the peak of the generator characteristic curve.
n This peak and the generator characteristic curve change with
the level of solar irradiation.
n Multiple peaks are a sign of partial shadowing (Fig. left).
n If the top of the curve is flat then the inverter can possibly no
longer feed power into the grid.
GB
747.431 | Z08 | 2014-01-31
90