
manual

6.1 Metering 151
time span. If you are monitoring playback or audio input, you will also note two vertical
lines following each VU meter bar, seemingly "trying to reach" the current RMS value.
These lines indicate the average of the most recent minimum RMS values (left line)
and the average of the most recent maximum RMS values (right line). To the left, the
difference between the minimum and maximum average values is displayed (the level
value in brackets) - this gives you an overview of the dynamic range of the audio material.
If you are monitoring real-time audio (playback or input), the maximum peak and loud-
ness values are displayed numerically to the right of the meter bars. Numbers in brack-
ets to the right of the Maximum Peak values indicate the number of successive clips
(0dB signal peaks). Recording levels should be set so that they only rarely clip. If the
master level is set too high, the sound quality and frequency response will be compro-
mised at high recording levels, with unwanted clipping effects. If the level is set too
low, noise levels may be high relative to the main sound being recorded.
Pan meters
The lower part of the window shows the pan (the difference in level between the left and
right channel, only applicable when monitoring stereo audio):
The upper pan meters show the peak level difference between the channels, graphically
and numerically. Note that the pan meters are "two-sided"; the level bars can go to the
left or right, indicating which channel is the loudest. The two sides are shown in different
colors (which can be changed via the Settings dialog as explained previously).
The lower pan meters show the average difference in loudness between the channels,
in a similar way. This gives you a visual indication of whether a stereo recording is
properly centered, for example.
If you are monitoring real-time audio (playback or input), the maximum balance differ-
ence value (peak and loudness) for each channel is displayed numerically to the left and
right of the meter bars. The VU meter can be found in the Meters menu of the Audio
Files and Audio Montage Workspaces.It can be used either as a floating window, or
docked in the Workspace or the Control Window.
Related topics
Metering
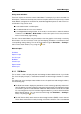
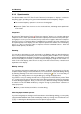
6.1.2 Spectroscope
The Spectroscope shows a continuous graphical representation of the frequency spectrum,
analyzed into 60 separate frequency bands, represented as vertical bars. Peak levels are
shown as a short horizontal lines above the corresponding band, indicating recent peak/-
maximum values. The Spectroscope offers a quick spectrum overview. For a more detailed
analysis of the audio spectrum, use the Spectrometer. The Spectroscope can be found in
the Meters menu of the Audio Files and Audio Montage Workspaces. It can be used ei-
ther as a floating window, or docked in the Workspace.It can also be docked in the Control
Window.
WaveLab 7