
manual


7.2 Shared tool windows 195
Docking windows
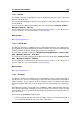
7.2.1 Background task monitor
This specific tool window allows you to view all background rendering processes that are in
progress.
You can adjust the priority with which they are processed, pause or cancel them. It is useful
if you have a number of lengthy processes underway and want to free up some processing
power to focus on editing. You can either lower the priority of a task so it does not use as
much of the computer processor's capacity, or pause the task temporarily.
You can access this window by choosing Workspace > Shared tool windows > Back-
ground task monitor. It is available in the Control Window, Audio File Workspace and
Audio Montage Workspace. You can also access this window in the Control Window by
choosing Utilities > Background task monitor.
You can choose to automatically open the Background task monitor when a rendering pro-
cess begins. To enable this option, select the checkbox via Options > Global Preferences
> Options > Make the Background Task Monitor visible when a task starts . Since
this window is a Shared tool window, the location where it opens may vary.
For an explanation of each parameter and interface feature, click on , or the 'What's this?'
question mark icon. For more information see Getting Help
Related topics
Specific tool windows
Control Window
Rendering
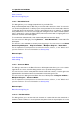
7.2.2 Log window
This shared tool window allows you to view log messages that have been issued by WaveLab.
When using WaveLab's scripting language for example, the logWindow( ) function outputs
messages to this window. There are a number of toggle buttons and these allow you to filter
the types of messages displayed.
Note: When using the logWindow( ) method you need to have the "Show informal notes"
button selected for the messages to be visible. If no log messages are displayed, make sure
all the toggle buttons are selected - .
You can access this window via Workspace > Shared tool windows > Log. It is available
in the Control Window, Audio File Workspace and Audio Montage Workspace. You can also
access this window in the Control Window via Utilities > Log.
For an explanation of each parameter and interface feature, click on , or the 'What's this?'
question mark icon. For more information see Getting Help
Related topics
WaveLab 7