
user manual


Chapter 6 Managing Ports 191
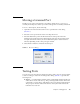
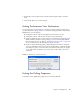
■ Select Other Port Diagnostics to open the Port Diagnostics dialog (this option
will disrupt traffic). Select the port number and Internal or External test type in
the drop-down list.
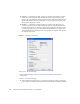
3. Enter a frame size (default is 256).
4. Enable or disable the Terminate Test Upon Error option.
5. Select a Loop Count option. The Loop Forever option runs the test until you click
the Stop Test button. The Loop Count option runs the test a specific number of
times.
6. Select a Test Pattern option. Accept the default test pattern, or select the User
Defined option and enter a value.
7. Click the Start Test button to begin the test. Observe the results in the Test Results
area.
Note – If the Test Status field in the Test Results area indicates Failed, note the Test
Fault Code displayed in the Port Information data window and contact Tech
Support.
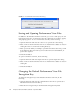
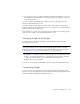
Graphing Port Performance
Performance View application displays port performance using graphs. Performance
View plots data communication rates and total errors for selected ports (
FIGURE 6-11).
When graphing data communication rates, you can choose frames/second or
KBytes/second. The maximum number of open graphs is 64.
On Solaris OS platforms, if you launch the Performance View application from the
Enterprise Fabric Suite 2007 application and Performance View can not connect to
the fabric, (for example, if you have reached the maximum number of Enterprise
Fabric Suite 2007 sessions on the entry switch), then Performance View opens with a
blue fabric icon displayed in the fabric tree.
Fabric status is displayed in text format after the fabric name in the fabric tree. The
color of the icon indicates the current connection status as normal (green), warning
(yellow), critical (red), or unmanageable (blue).