Surge Protector/Power Conditioner/ Diagnostic Software User Manual 120 and 120/230 Volt Models 120V Firmware Revision 1.40 and higher 120/230V Firmware Revision 1.0 and higher Software Revision 2.7 © 2013 Electronic Systems Protection, Inc. / www.surgex.
User Manual © 2013 SurgeX / Electronic Systems Protection, Inc. / Technical Support 800.645.9721 / www.surgex.
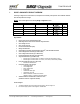
User Manual 1. Surge + Diagnostic Product Overview 3 2. Intallation Instructions 4 2.1 2.2 2.3 2.4 3. Surge + Diagnostic Installation ...............................................................................................................4 Surge + Diagnostic PC and Driver Installation ........................................................................................6 Configure PC Settings for COM Port ......................................................................................
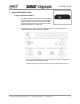
User Manual 1. SURGE + DIAGNOSTIC PRODUCT OVERVIEW The Surge + Diagnostic is a state-of-the-art, microprocessor-controlled, power protector and conditioner with realtime data acquisition and storage.
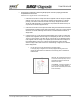
User Manual 2. INSTALLATION INSTRUCTIONS 2.1 Surge + Diagnostic Installation: a. Rack Mount: Designed to be installed in a 19 inch equipment rack and require one or two units (1RU, 2RU) of rack space, depending on model. Use the four thumbscrews (included) to secure the rack ears to the rack rails. These screws can be tightened by hand and do not require tools. b.
User Manual c. Connect Surge + Diagnostic to Outlet: Plug the input power cord into a properly grounded and compatible branch circuit outlet. Please Note: Do not plug the Filter into a re-locatable power tap. i.
User Manual 2.2 Surge + Diagnostic PC and Driver Installation Please Note: The Surge + Diagnostic unit may be accessed by a PC while connected to AC power and equipment, or while disconnected from AC power and equipment. If accessed by a PC while connected to AC power: For best protection, it is recommended that the power cord of the computer is plugged into an available receptacle on the Surge + Diagnostic.
User Manual 2.3 Configure PC Settings for COM Port *Note: The COM Port Settings procedure has been automated in software version 2.7. See Section 2 – 2.4 – C for details. a. Open Device Manager i. Windows XP 1. Click on Start and then select Run. 2. Type the following command in the “Open:” text box: devmgmt.msc 3. Click on the OK button. 4. Device Manager will display. ii. Windows Vista / 7 / 8 1. Click on Start button 2. Type the following command in the “Search:” text box: devmgmt.msc 3.
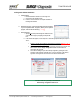
User Manual 2.4 Diagnostic Software Installation a. Install Software: b. Starting the program: Open the “ESP Next Gen PCS” Software on your PC (located under “Programs”). When you first open the program, it will look like the following. c. Select COM Port: i. Download Software Installer from www.surgex.com. ii. Unzip and run the installation utility. iii. Follow on-screen instructions to complete installation of the Diagnostic Software i.
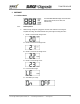
User Manual 3. HARDWARE 3.1 LCD Event Monitor The LCD EVENT MONITOR displays useful information related to data collection, device status, and troubleshooting. 3.1.1. Normal Operation a. When the Surge + Diagnostic is plugged into a branch circuit outlet with correct wiring and acceptable line voltage, the LCD Event Monitor will cycle through the following information: i. Number of recorded Under-Voltage events: vi. Number of recorded Over-Voltage events: iii.
User Manual 3.1.2. Wiring Fault When connected to an incorrectly wired branch circuit outlet, in addition to the illumination of the Red LED, the LCD Event Monitor will display the following information: 3.1.3.
User Manual 3.2 Clearing Memory The Surge + Diagnostic is able to timestamp the 60 most recent power quality events (information stored in microcontroller non-volatile memory). The microcontroller memory contents can be cleared at any time by following one of these two methods: 3.2.1 RST Button There is a recessed push button located on the front panel. a. Follow these steps to clear the device memory: 1. Unplug the input cord of the Surge + Diagnostic from the branch circuit outlet. 2.
User Manual 3.3 Data Interface Cable a. The Data Interface Cable consists of a USB connection on one end, and an RJ-11 connection on the opposite end. b. The USB connection plugs into an available USB port on your PC. The RJ-11 connection plugs into the RJ-11 “OUT” Jack (labeled “Data Port”) on the Surge + Diagnostic, which is the jack closest to the LCD Event Monitor and RST button. c. Instructions for Data Retrieval i. Connect the Surge + Diagnostic Data Interface Cable into the USB port on your PC. ii.
User Manual 4. DIAGNOSTIC SOFTWARE 4.1 How to Connect to Surge + Diagnostic a. Starting the Program: Open the “ESP Next Gen PCS” Diagnostic Software (located under “Programs” on your PC Start Menu). b. Please Note: A shortcut to this manual will also be located in this location on your PC for future reference and troubleshooting. i. Connecting the Software: 1.
User Manual 4.2 GUI Overview: After connecting successfully, several pieces of information gathered from the Surge + Diagnostic will now be displayed on the Diagnostic Software Graphical User Interface. a. Connection Status: The current connection status is displayed to the right of the Connect/Disconnect button. b. Disconnect: Pressing the green button beside “Status” will terminate communications with the Surge + Diagnostic. c.
User Manual e. Outlet Status: Outlet Status is displayed below Connection Status. The current state of the outlets is displayed (either On or Off), and pressing the On/Off button will manually turn the output On and Off.
User Manual 4.3 Menu Items: a. File Menu: i. Import Data From XG: Manually import data stored in the Surge + Diagnostic internal memory. ii. Import Data From File: Import data from a previously stored data file. Does not require Surge + Diagnostic connectivity. iii. Export Data To File: Exports the currently displayed data to a data file, which can be imported for future viewing. The data file may be saved as text (.txt) or comma-separated (.csv, suitable for viewing in MS Excel).
User Manual iv. Voltage Limits: Displays the over-voltage and under-voltage shutdown thresholds currently in use, and allows for the selection of alternate values. *When Under-Voltage Shutdown is Disabled, the Surge + Diagnostic will not actively shut off connected equipment during an under-voltage event. However, the Surge + Diagnostic power relays will drop out and disconnect equipment around 40V. This is because there is not enough voltage available to keep the relays latched. v.
User Manual 4.4 Voltage Limit Selection a. b. Navigate to “Setup/Voltage Limits” in the menu. The Voltage Limit selection screen will appear with the currently active limits selected: c. d. To change the limits, check the boxes beside the desired values and press “Save Limits”. When the new limits have been successfully saved in the Surge + Diagnostic, the following message will be displayed: Press “OK” to complete the voltage limit selection process. e. 4.5 Cycle Power Command a.
User Manual 4.6 Enhanced Logging Mode a. The Enhanced Logging Mode function of the Diagnostic Software extends the logging and monitoring capabilities of the Surge + Diagnostic while a PC is connected. b. Enhanced Logging Mode can be started by navigating to “Tools/Enhanced Logging Mode”. i. The additional features available with the Enhanced Logging Mode are: 1. Logging of individual line voltage measurements a. The magnitude of the line voltage of each data acquisition point is recorded. b.
User Manual 4.7 Graph Overview & Control a. Graph Control i. The graphs used to display the recorded power quality events (normal mode) and line voltage (Enhanced Logging Mode) contain Zoom, Cross Hair, and Drag functions that are useful when analyzing data: Legend: Press the L icon to display the Graph Legend to show the values of the Time Stamped data. Pressing the icon again toggles the legend off. Zoom: Press the magnifying glass icon to enable Zoom mode.
User Manual 3. All events recorded while a computer is connected to the Surge + Diagnostic will have an accurate date and time stamp, since the computer will supply power to the Surge + Diagnostic microcontroller in the event of a power outage (as long as the computer stays on). 4.
User Manual 6. Cross Hair Function: The cross hair tool is useful when determining the estimated date/time of an event, as well as the type of the event. Pressing the cross hair icon will place a cross hair on one of the graph’s data points, and the corresponding date/time and type of that event will be displayed when the mouse pointer hovers over that point. To move the cross hair to a different data point, simply position the mouse pointer over the data point of interest. 7.
User Manual 8. Zoom Function: The line voltage graph may be zoomed along both the X (time) and Y (Voltage) axes. To zoom in on an area of the graph, press the magnifying glass icon, press and hold the left mouse button somewhere on the graph, drag the cursor to define the zoom selection, and then release the left mouse button. The graph will now display the selected area. Press the magnifying glass icon to restore the original full display. 9.
User Manual 5. TROUBLESHOOTING: The Surge + Diagnostic and Data Interface Cable contain no user-serviceable parts. Do not attempt product disassembly, as this will void the product warranty. 5.1 Surge + Diagnostic Symptom Possible Cause What To Do Red LED On, Green LED Off, No power at output. Incorrectly wired branch circuit outlet. The LCD Event Monitor will display the nature of the wiring fault. Contact a licensed electrician to correct the branch circuit outlet wiring.
User Manual 6.
User Manual 6. SPECIFICATIONS (cont’d) Parameter Computer Requirements Dimensions Weight Temperature Range Humidity Range Agency Listings SX-HS-15-R SX-HS-20-R SX-HS-L530-R SX-HS-L630-R SX-HS-L630-RDB SX-HS-15-R SX-HS-20-R SX-HS-L530-R SX-HS-L630-R SX-HS-L630-RDB SX-HS-15-R SX-HS-20-R SX-HS-L530-R SX-HS-L630-R SX-HS-L630-RDB Specification For use with Surge + Diagnostic Diagnostic Software.