
User's Manual

SurveyMonkey User Manual
Page 52
Create and Export Custom Charts:
Want to present survey data to your team in a quick and clean format? Or maybe you
need to visually analyze the data through different options? If so, charting is available
within the Analyze section. Professional subscribers can customize and download the
following types:
Pie
Bar
Area
Line
Column
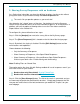
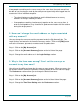
Step 1: Click the [Analyze] icon to the right of the survey on the My Surveys page.
Step 2: The Response Summary section opens. Click the View All Pages button to see
all of the questions.
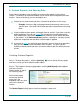
To create a chart for a specific question, click the [Create Chart] button associated with
the question.
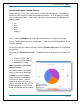
This opens the Create Chart prompt. The default chart will be active. In this editor, you
will:
1. Choose a Chart Type.
2. Create the Chart Settings.
3. Download the Chart.
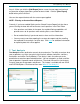
NOTE: Are charts saved in the
Analyze section?
No. Once you have created the
chart as you want it, download it
immediately to your computer.
After 15 minutes, the database
refreshes the cache. You can
continue to edit the chart for as
long as you want, but after any 15
minute period where no edits are
made, the changes will be cleared.