
- Norton 360 Antivirus Software Manual
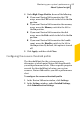

Events graph at the top of the Performance window
displays each activity as icon or stripe. The description
for each icon or stripe appears at the bottom of the
graph. The pop-up that appears when you move the
mouse pointer over an icon provides you the details
about the activity. The details include the date on which
an activity was performed and the number of such
activities that you performed on that date. The View
Details link provides additional details of the activity
in the Security History window.
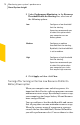
To view details of your system activities
1
In the Norton 360 main window, click Performance.
2
In the Performance window, at the top of the Events
graph, click the tab for a month to view the details.
3
In the Events graph, move the mouse pointer over
the icon or the stripe for an activity.
4
In the pop-up that appears, view the details of the
activity.
5
If the View Details option appears in the pop-up,
click View Details to view additional details in the
Security History window.
About performance alerting
Norton 360 monitors your system performance. If it
detects an increased usage of system resources by any
program or process, it notifies you with performance
alerts. Performance alerting works only when the
Performance Monitoring option and Performance
Alerting option are turned on.
Performance alerting notifies you with information
about the program name and resources that the
program uses excessively. The Details & Settings link
in the performance notification alert lets you view
additional details about the resource consumption by
the program. The File Insight window opens and
displays the details of the file, the origin of the file, the
process ID, and the complete resource usage list of the
program. From the FileInsight window, you can choose
65Monitoring your system's performance
About System Insight