
Datasheet


Datasheet
SR-ENET, 10BASE-T, and 100BASE-TX
Triggering and Analysis
Debugging Ethernet-based embedded systems designs provides some
complex measurement and analysis challenges:
• Capturing specific Ethernet addresses and data
• Displaying the elements of the Ethernet message in an understandable
format, in a variety of formats, for a wide variety of engineers and
technicians
• Time-correlating Ethernet messages with analog and digital signals in the
embedded system
• Capturing long time windows of Ethernet traffic and then finding specific
events within the acquired data
The optional SR-ENET application software, installed in an MSO/DPO5000,
or DPO7000C, or DPO/DSA/MSO70000C/D/DX Series oscilloscope,
provides a robust set of tools for debugging embedded systems with
10BASE-T and 100BASE-TX Ethernet, including:
• Automated serial decode and search for Ethernet 10BASE-T and
100BASE-TX
• Serial triggering (MSO/DPO5000 Series only) on all the critical elements of
an Ethernet 10BASE-T and 100BASE-TX such as address, data, etc.
• Decoding IPv4 internet protocol and TCP transport protocol
• Decoding all the critical elements of each message. No more counting 1s
and 0s!
• Searching through long acquisitions using user-defined criteria to find
specific messages
• Event Table showing decoded serial bus activity in a tabular, time-stamped
format for quick summary of system activity
10BASE-T and 100BASE-TX Triggering
Trigger on packet content such as start frame delimiter (SFD), MAC
addresses, MAC length/type, MAC client data, Q-tag control information,
IPv4 and TCP header, TCP and IPv4 client data, end-of-packet, and FCS
errors.
10BASE-T and 100BASE-TX Decode
The SR-ENET Ethernet Serial Application p rovides a higher-level,
combined view of the individual signals that make up the 10BASE-T or
100BASE-TX bus, making it easy to identify where packets begin and
end and identifying subpacket components such as preamble, SFD, MAC
addresses, data, FSC, errors, etc.
Are you wasting time manually decoding the waveform? Tired of having
to visually inspect the waveform to count clocks, determine if each bit is
a 1 or a 0, combine bits into bytes, and determine the hex value? Let the
oscilloscope with the SR-ENET application do it for you! Once you’ve set up
a 10BASE-T or 100BASE-TX bus, the MSO/DPO5000, or DPO7000C, or
DPO/DSA/MSO70000C/D/DX Series will decode each packet on the bus,
and display the value in hex, binary, or decimal in the bus waveform.
10BASE-T and 100BASE-TX Event Table
In addition to seeing 10BASE-T and 100BASE-TX decoded data on the
bus waveform itself, you can view all captured packets in a tabular view
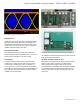
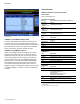
Color-coded display of 100BASE-TX, showing preamble, MAC addresses, IP header,
TCP header components of the serial signal
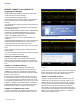
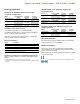
100BASE-TX decoded Event Table showing all packet information with time stamp
information
much like you would see in a software listing. Packets are time stamped and
listed consecutively with columns for each component (Time, Destination
Address, Source Address, Length, Data, FCS/CRC, and Errors).
10BASE-T and 100BASE-TX Search
Triggering i s very useful for isolating the event of interest, but once you’ve
captured it and need to analyze the surrounding data, what do you do? In
the past, users had to manually scroll through the waveform counting and
converting bits and looking for what caused the event. With the SR-ENET
application installed, you can enable the oscilloscope to automatically
search through the acquired data for user-defined criteria including packet
content. Each occurrence is highlighted by a search mark. Rapid navigation
between marks is as simple as pressing the Previous () and Next ()
buttons on the oscilloscope front panel.
4 www.tektronix.com