
User Manual
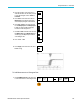
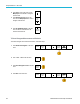
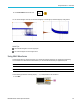
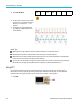
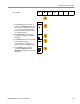
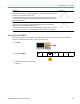
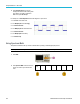
Table Of Contents
- toc
- Important safety information
- Compliance information
- Preface
- Installation
- Before Installation
- Operating Considerations
- Connecting Probes
- Securing the Oscilloscope
- Powering on the Oscilloscope
- Powering off the Oscilloscope
- Functional Check
- Compensating a TPP0250, TPP0500B or TPP1000 Passive Voltage Prob
- Compensating a non-TPP0250, non-TPP0500B or non-TPP1000 Passive
- Application Module Free Trial
- Installing an Application Module
- Upgrading Bandwidth
- Changing the Language of the User Interface or Keyboard
- Changing the Date and Time
- Signal Path Compensation
- Upgrading Firmware
- Connecting Your Oscilloscope to a Computer
- Connecting a USB Keyboard to Your Oscilloscope
- Get Acquainted with the Instrument
- Acquire the Signal
- Setting Up Analog Channels
- Using the Default Setup
- Using Autoset
- Acquisition Concepts
- Using FastAcq
- How the Analog Acquisition Modes Work
- Changing the Acquisition Mode, Record Length, and Delay Time
- Using Roll Mode
- Act on Event
- Setting Up a Serial or Parallel Bus
- Setting Up Digital Channels
- When and Why to Turn On MagniVu
- Using MagniVu
- Setting Up the RF Inputs
- Trigger Setup
- Display Waveform or Trace Data
- Adding and Removing a Waveform
- Setting the Display Style and Persistence
- Setting Waveform Intensity
- Scaling and Positioning a Waveform
- Setting Input Parameters
- Positioning and Labeling Bus Signals
- Positioning, Scaling, and Grouping Digital Channels
- Viewing Digital Channels
- Annotating the Screen
- Viewing the Trigger Frequency
- Displaying the Frequency Domain Menu
- Analyze Waveform or Trace Data
- Using Markers in the Frequency Domain
- Taking Automatic Measurements in the Time Domain
- Selecting Automatic Measurements in the Time Domain
- Customizing an Automatic Measurement in the Time Domain
- Taking Automatic Measurements in the Frequency Domain
- Taking Digital Voltmeter Measurements
- Taking Manual Measurements with Cursors
- Setting Up a Histogram
- Using Math Waveforms
- Using FFT
- Using Advanced Math
- Using Spectrum Math
- Using Reference Waveforms and Traces
- Using Wave Inspector to Manage Long Record Length Waveforms
- Auto-magnify
- Limit and Mask Testing
- Making Video Tests
- Making Automated Power Measurements
- Save and Recall Information
- Use the Arbitrary Function Generator
- Use the Application Modules
- Appendix A: Warranted Specifications
- Appendix B: TPP0250, TPP0500B and TPP1000: 250€MHz, 500€MHz and
- Appendix C: P6316 General-Purpose Logic Probe Information
- Appendix D: OpenSSL License
Analyze Wavefor
morTraceData
4. Push the top bu
tton on the side menu to
select the waveform axis for which you want
to show the histogram values: Vertical or
Horizontal.
Off
Vertical
Horizontal
5. Push Source on the side menu and turn
Multipurpos
eato select the channel for
which to display histogram measurements.
Source
(a) 1
6. Push Horiz. Limits on the side menu and
turn the Mul
tipurpose a and Multipurpose
b knobs to set the L (left) and R (right)
boundaries of the histogram box.
Horiz.
Limits
L(a)
-584ns
R(b)
760ns
7. Push Vert. Limits on the side menu and turn
the Multip
urpose a and Multipurpose b to
set the T (top) and B (bottom) boundaries
of the histogram box.
Vert.
Limits
T(a)
-584ns
B(b)
760ns
8. Push -more
-1of2.
-more-
1of2
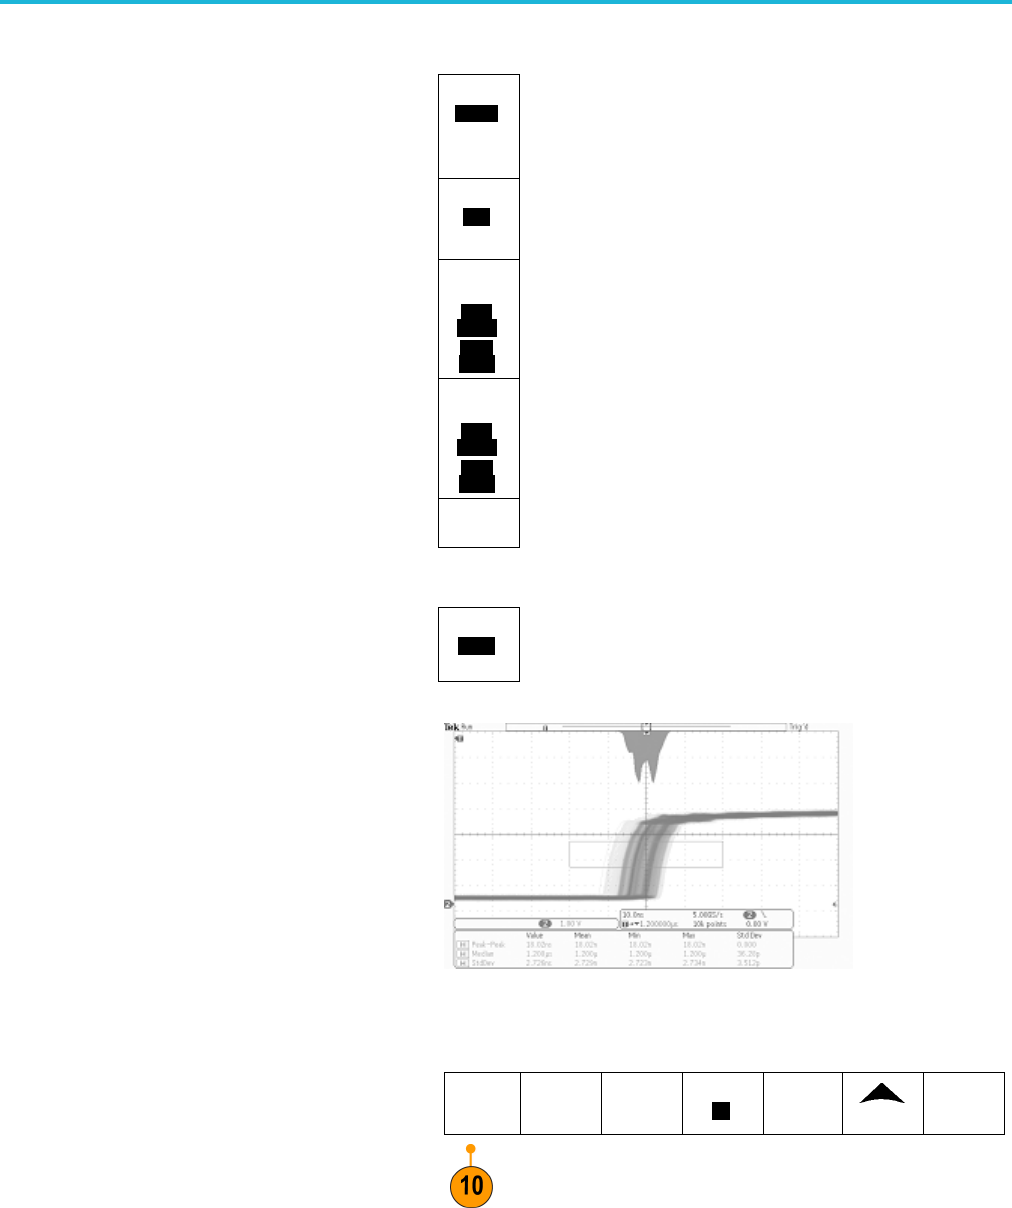
9. Push Display on the side menu and select
Linear or
Log.
Display
Linear
Log
To Add Measurements on Histogram Data
1. Push Add Measurem ent on the lower menu
to add measurements on the histogram data.
Add Mea-
surement
Remove
Measure-
ment
Indicators DVM
DC
Wave-
form His-
tograms
More
MDO3000 Series Oscilloscopes User Manual 139