
User Manual
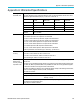
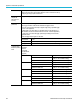
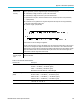
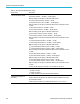
Table Of Contents
- toc
- Important safety information
- Compliance information
- Preface
- Installation
- Before Installation
- Operating Considerations
- Connecting Probes
- Securing the Oscilloscope
- Powering on the Oscilloscope
- Powering off the Oscilloscope
- Functional Check
- Compensating a TPP0250, TPP0500B or TPP1000 Passive Voltage Prob
- Compensating a non-TPP0250, non-TPP0500B or non-TPP1000 Passive
- Application Module Free Trial
- Installing an Application Module
- Upgrading Bandwidth
- Changing the Language of the User Interface or Keyboard
- Changing the Date and Time
- Signal Path Compensation
- Upgrading Firmware
- Connecting Your Oscilloscope to a Computer
- Connecting a USB Keyboard to Your Oscilloscope
- Get Acquainted with the Instrument
- Acquire the Signal
- Setting Up Analog Channels
- Using the Default Setup
- Using Autoset
- Acquisition Concepts
- Using FastAcq
- How the Analog Acquisition Modes Work
- Changing the Acquisition Mode, Record Length, and Delay Time
- Using Roll Mode
- Act on Event
- Setting Up a Serial or Parallel Bus
- Setting Up Digital Channels
- When and Why to Turn On MagniVu
- Using MagniVu
- Setting Up the RF Inputs
- Trigger Setup
- Display Waveform or Trace Data
- Adding and Removing a Waveform
- Setting the Display Style and Persistence
- Setting Waveform Intensity
- Scaling and Positioning a Waveform
- Setting Input Parameters
- Positioning and Labeling Bus Signals
- Positioning, Scaling, and Grouping Digital Channels
- Viewing Digital Channels
- Annotating the Screen
- Viewing the Trigger Frequency
- Displaying the Frequency Domain Menu
- Analyze Waveform or Trace Data
- Using Markers in the Frequency Domain
- Taking Automatic Measurements in the Time Domain
- Selecting Automatic Measurements in the Time Domain
- Customizing an Automatic Measurement in the Time Domain
- Taking Automatic Measurements in the Frequency Domain
- Taking Digital Voltmeter Measurements
- Taking Manual Measurements with Cursors
- Setting Up a Histogram
- Using Math Waveforms
- Using FFT
- Using Advanced Math
- Using Spectrum Math
- Using Reference Waveforms and Traces
- Using Wave Inspector to Manage Long Record Length Waveforms
- Auto-magnify
- Limit and Mask Testing
- Making Video Tests
- Making Automated Power Measurements
- Save and Recall Information
- Use the Arbitrary Function Generator
- Use the Application Modules
- Appendix A: Warranted Specifications
- Appendix B: TPP0250, TPP0500B and TPP1000: 250€MHz, 500€MHz and
- Appendix C: P6316 General-Purpose Logic Probe Information
- Appendix D: OpenSSL License
Appendix A: Warr
anted Specifications
Delta Time
Measurement
Accuracy
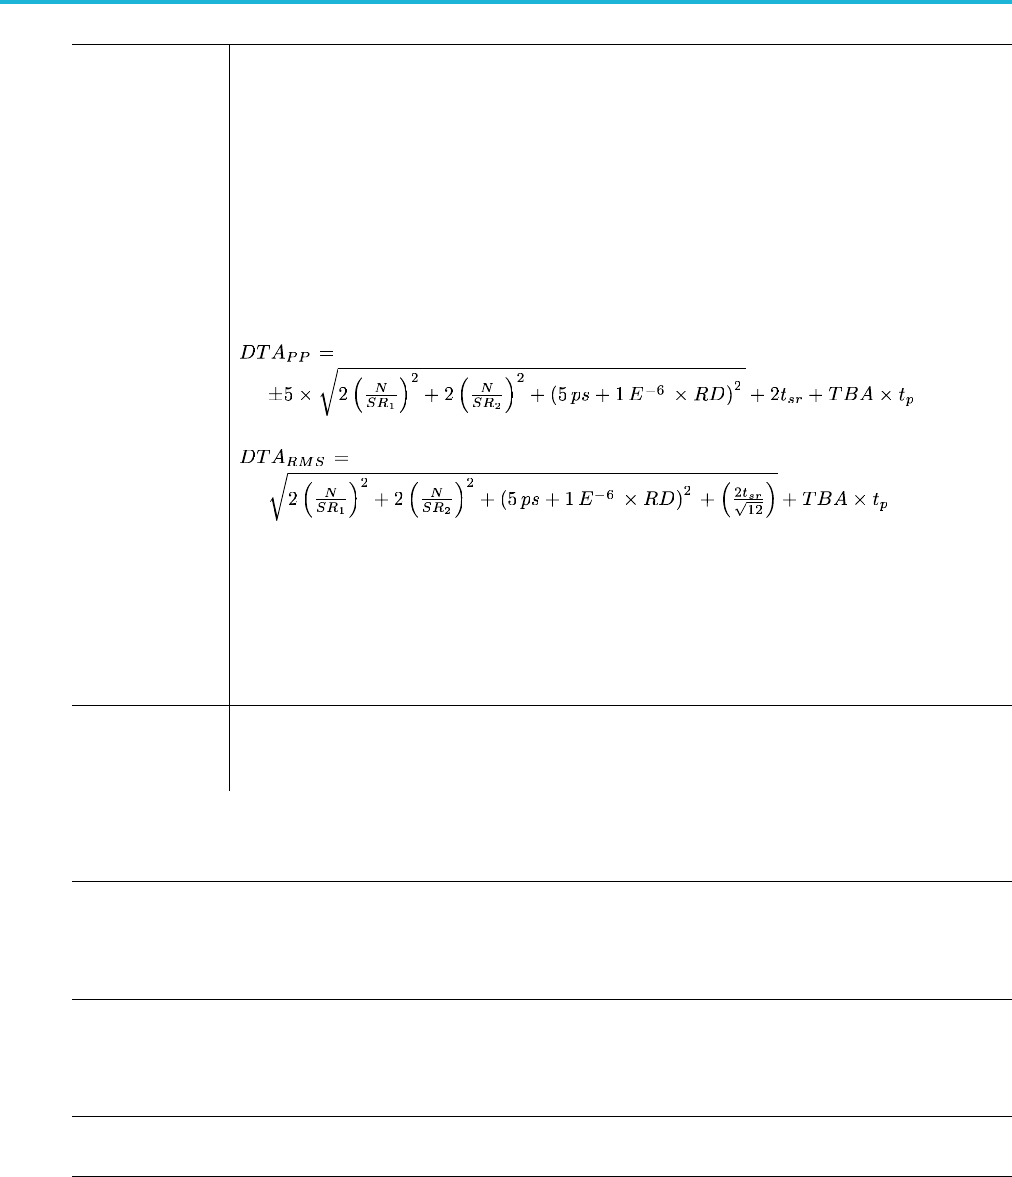
The formula to calculate delta-time measurement accuracy (DTA) for a given instrument setting and input
signal is given below (assumes insignificant signal content above Nyquist)
SR
1
=SlewRate
(1
st
Edge) around the 1
st
point in the m easurement
SR
2
=SlewRate(2
nd
Edge) around the 2
nd
point in the m easurement
N = input-referred noise (volts
rms
, Refer to the Random Noise, Sample acquisition mode specification)
t
sr
=1/(Samp
le Rate)
TBA = timebase accuracy (Refer to the Long-term sample rate and delay time accuracy specifi cation)
t
p
= delta-time measurement duration (sec)
RD = (R ecord
Length) / (Sample Rate)
Assumes that error due to aliasing is insignificant.
The term under the square-root sign is the stability, and is due to TIE (Time Interval Error). The errors due
to this term occur throughout a single-shot measurement. The second term is due to both the absolute
center-frequency accuracy and the center-frequency stability of the timebase and varies between multiple
single-shot measurements over the observation interval (the amount of time from the first single-shot
measurement to the final single-shot measurement).
Threshold
Accuracy, digital
input
+/- [100 mV + 3% of threshold setting after calibration]
Requires valid SPC.
Table 1: RF Channel Characteristics
Characteristic Description
Phase Noise
10 kHz: < –81 dBc/Hz; (–85 dBc/Hz, typical)
100 kHz: < –97 dBc/Hz; (–101 dBc/Hz, typical)
1 MHz: < –118 dBc/Hz; (–122 dB c/Hz, typical)
Phase Noise measured offset from 1 GHz CW signal.
Displayed Average Noise Level
(DANL)
9 kHz to 50 kHz: < –109 dBm/Hz; (< –113 dBm/Hz, typical)
50 kHz to 5 MHz: < –126 dBm/Hz; ( –130 dB m/Hz, typical)
5 MHz to 2 GHz : < –138 dBm/Hz; (< –142 dBm/Hz, typical)
2 GHz to 3 GHz: < –128 dBm/Hz; (< –132 dBm/Hz, typical)
Level Measurement Uncertainty
< ±1.2 dB, < ±0.6 dB (typical), 18 °C - 28 °C temperature range
< ±2.0 dB, –10 °C to +55 °C
MDO3000 Series Oscilloscopes User Manual 195