
User Manual
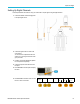

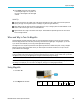
Table Of Contents
- toc
- Important safety information
- Compliance information
- Preface
- Installation
- Before Installation
- Operating Considerations
- Connecting Probes
- Securing the Oscilloscope
- Powering on the Oscilloscope
- Powering off the Oscilloscope
- Functional Check
- Compensating a TPP0250, TPP0500B or TPP1000 Passive Voltage Prob
- Compensating a non-TPP0250, non-TPP0500B or non-TPP1000 Passive
- Application Module Free Trial
- Installing an Application Module
- Upgrading Bandwidth
- Changing the Language of the User Interface or Keyboard
- Changing the Date and Time
- Signal Path Compensation
- Upgrading Firmware
- Connecting Your Oscilloscope to a Computer
- Connecting a USB Keyboard to Your Oscilloscope
- Get Acquainted with the Instrument
- Acquire the Signal
- Setting Up Analog Channels
- Using the Default Setup
- Using Autoset
- Acquisition Concepts
- Using FastAcq
- How the Analog Acquisition Modes Work
- Changing the Acquisition Mode, Record Length, and Delay Time
- Using Roll Mode
- Act on Event
- Setting Up a Serial or Parallel Bus
- Setting Up Digital Channels
- When and Why to Turn On MagniVu
- Using MagniVu
- Setting Up the RF Inputs
- Trigger Setup
- Display Waveform or Trace Data
- Adding and Removing a Waveform
- Setting the Display Style and Persistence
- Setting Waveform Intensity
- Scaling and Positioning a Waveform
- Setting Input Parameters
- Positioning and Labeling Bus Signals
- Positioning, Scaling, and Grouping Digital Channels
- Viewing Digital Channels
- Annotating the Screen
- Viewing the Trigger Frequency
- Displaying the Frequency Domain Menu
- Analyze Waveform or Trace Data
- Using Markers in the Frequency Domain
- Taking Automatic Measurements in the Time Domain
- Selecting Automatic Measurements in the Time Domain
- Customizing an Automatic Measurement in the Time Domain
- Taking Automatic Measurements in the Frequency Domain
- Taking Digital Voltmeter Measurements
- Taking Manual Measurements with Cursors
- Setting Up a Histogram
- Using Math Waveforms
- Using FFT
- Using Advanced Math
- Using Spectrum Math
- Using Reference Waveforms and Traces
- Using Wave Inspector to Manage Long Record Length Waveforms
- Auto-magnify
- Limit and Mask Testing
- Making Video Tests
- Making Automated Power Measurements
- Save and Recall Information
- Use the Arbitrary Function Generator
- Use the Application Modules
- Appendix A: Warranted Specifications
- Appendix B: TPP0250, TPP0500B and TPP1000: 250€MHz, 500€MHz and
- Appendix C: P6316 General-Purpose Logic Probe Information
- Appendix D: OpenSSL License
Acquire the Sign
al
Physical Layer Bus Activity
Oscilloscope waveform traces from analog channels 1 to 4, digital channels D15 to D0, M ath waveforms, and the traces you
see when you choose to display a bus always show the physical layer bus activity. In the physical layer display, bits that were
transmitted earlier are to the left, and bits that were transmitted later are to the right.
I
2
C, and CAN and CAN FD buses transmit the MSB (most significant bit) first
SPI buses do not specify a bit order
RS-232 and LIN buses transmit the LSB (least significant bit) first
NOTE. The oscilloscope displays the decode traces and event tables for all buses with the MSB on the left and LSB
on the right.
For example, an RS-232 signal (after the start bit) might be high, high, high, low, high, low, lo w, and high. Since the RS-232
protocol uses high for zero and low for one, this value would be 0001 0110.
Since the decode displays the MSB first, the o scilloscope reverses the order of the bits and displays 0110 1000. If the bus
display is set to hex, the value displays as 68. If the bus display is set to AS CII, the value displays as h.
Event Table
In addit
ion to seeing decoded packet data on the bus waveform itself, you can view all captured packets in a tabular
view much like you would see in a software listing. Packets are time stamped and listed consecutively with columns for
each component (Address, Data, etc.). You can save the event table data in .CSV format for detailed offline analysis.
Using t
he Event Table, you can:
Scroll
the event table to update the view point in the waveform.
Each ro
w in the event table represents a time-stamped byte, packet, or word, depending on the bus type. As you scroll
the event table using the multipurpose knob, the view point in the oscilloscope display updates to show the position in the
waveform corresponding to the event in the Event Table.
Save the event table. (See page 68, Setting Up Bus Parameters.)
Saving an event table may save more data than can be presented on the oscilloscope. Use these saved files for
in-de
pth offline analysis.
80 MDO3000 Series Oscilloscopes User Manual