
User Manual
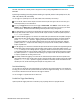
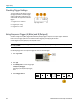
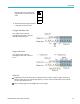
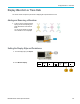
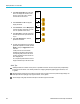
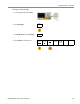
Table Of Contents
- toc
- Important safety information
- Compliance information
- Preface
- Installation
- Before Installation
- Operating Considerations
- Connecting Probes
- Securing the Oscilloscope
- Powering on the Oscilloscope
- Powering off the Oscilloscope
- Functional Check
- Compensating a TPP0250, TPP0500B or TPP1000 Passive Voltage Prob
- Compensating a non-TPP0250, non-TPP0500B or non-TPP1000 Passive
- Application Module Free Trial
- Installing an Application Module
- Upgrading Bandwidth
- Changing the Language of the User Interface or Keyboard
- Changing the Date and Time
- Signal Path Compensation
- Upgrading Firmware
- Connecting Your Oscilloscope to a Computer
- Connecting a USB Keyboard to Your Oscilloscope
- Get Acquainted with the Instrument
- Acquire the Signal
- Setting Up Analog Channels
- Using the Default Setup
- Using Autoset
- Acquisition Concepts
- Using FastAcq
- How the Analog Acquisition Modes Work
- Changing the Acquisition Mode, Record Length, and Delay Time
- Using Roll Mode
- Act on Event
- Setting Up a Serial or Parallel Bus
- Setting Up Digital Channels
- When and Why to Turn On MagniVu
- Using MagniVu
- Setting Up the RF Inputs
- Trigger Setup
- Display Waveform or Trace Data
- Adding and Removing a Waveform
- Setting the Display Style and Persistence
- Setting Waveform Intensity
- Scaling and Positioning a Waveform
- Setting Input Parameters
- Positioning and Labeling Bus Signals
- Positioning, Scaling, and Grouping Digital Channels
- Viewing Digital Channels
- Annotating the Screen
- Viewing the Trigger Frequency
- Displaying the Frequency Domain Menu
- Analyze Waveform or Trace Data
- Using Markers in the Frequency Domain
- Taking Automatic Measurements in the Time Domain
- Selecting Automatic Measurements in the Time Domain
- Customizing an Automatic Measurement in the Time Domain
- Taking Automatic Measurements in the Frequency Domain
- Taking Digital Voltmeter Measurements
- Taking Manual Measurements with Cursors
- Setting Up a Histogram
- Using Math Waveforms
- Using FFT
- Using Advanced Math
- Using Spectrum Math
- Using Reference Waveforms and Traces
- Using Wave Inspector to Manage Long Record Length Waveforms
- Auto-magnify
- Limit and Mask Testing
- Making Video Tests
- Making Automated Power Measurements
- Save and Recall Information
- Use the Arbitrary Function Generator
- Use the Application Modules
- Appendix A: Warranted Specifications
- Appendix B: TPP0250, TPP0500B and TPP1000: 250€MHz, 500€MHz and
- Appendix C: P6316 General-Purpose Logic Probe Information
- Appendix D: OpenSSL License
Display Wavefor
morTraceData
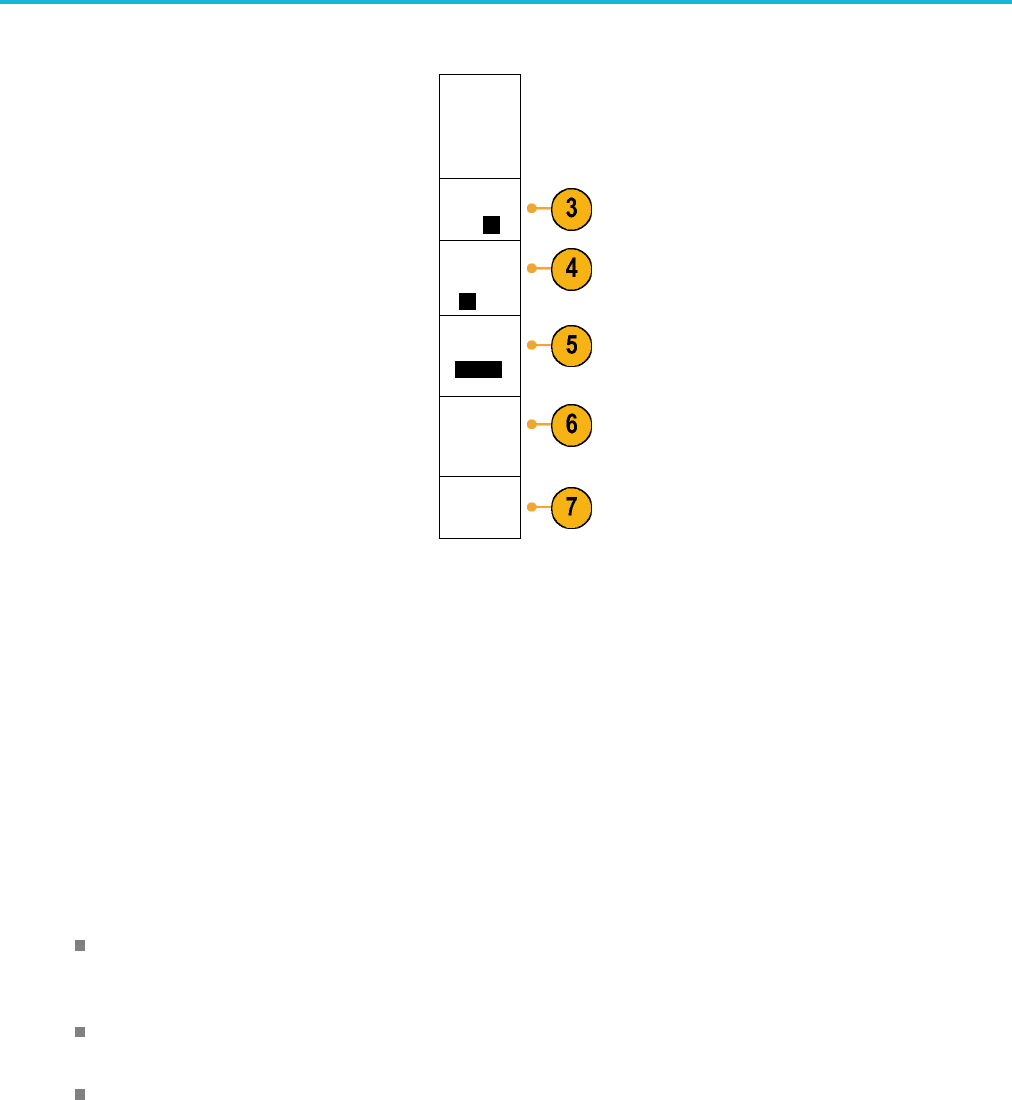
3. Push Dots Only On Off on the side menu.
Dots on w ill display the waveform record
points as dots
on the screen. Dots off
connects the dots with vectors.
Waveform
Display
Dots Only
On
Off
4. Push Persis
tence to Off to display the
display persistence.
Persis-
tence
On Off
5. Push Persist Time, and turn Multipu rpo se
a to have wa
veform data remain on screen
for a user-specified amount of time.
Persist
Time
(a) Auto
6. Push Set to
Auto to have the oscilloscope
automatically determine a persistence time
for you.
Set to Auto
7. Push Clear Persistence to reset the
persistence information.
Clear Per-
sistence
8. To display the amplitude from one waveform
against the amplitude from another, push XY
Displa
y. Then push Triggered XY from the
side menu.
A data point from the first waveform
specifi
es the horizontal location while the
corresponding data point from the second
waveform specifies the vertical location for
each d
isplayed point.
You can optionally view both the YT and XY
displays simultaneously on the same screen.
Quick Tips
Variable persistence accumula tes record points for a s pecified time interval. Each record point decays independently
according to the time interval. U se variable persistence for displaying infrequently appearing signal anomalies, such
as glitches.
Infinite persistence continuously accumulates record points until you change one of the acquisition display settings. Use
infinite persistence for displaying unique signal anomalies, such as glitches.
The XY D isplay mode graphs the data in fixed pairs of waveforms against one another.
104 MDO3000 Series Oscilloscopes User Manual