
User Manual
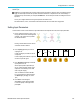
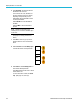
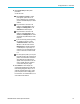
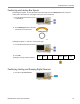
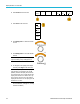
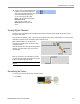
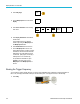
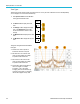
Table Of Contents
- toc
- Important safety information
- Compliance information
- Preface
- Installation
- Before Installation
- Operating Considerations
- Connecting Probes
- Securing the Oscilloscope
- Powering on the Oscilloscope
- Powering off the Oscilloscope
- Functional Check
- Compensating a TPP0250, TPP0500B or TPP1000 Passive Voltage Prob
- Compensating a non-TPP0250, non-TPP0500B or non-TPP1000 Passive
- Application Module Free Trial
- Installing an Application Module
- Upgrading Bandwidth
- Changing the Language of the User Interface or Keyboard
- Changing the Date and Time
- Signal Path Compensation
- Upgrading Firmware
- Connecting Your Oscilloscope to a Computer
- Connecting a USB Keyboard to Your Oscilloscope
- Get Acquainted with the Instrument
- Acquire the Signal
- Setting Up Analog Channels
- Using the Default Setup
- Using Autoset
- Acquisition Concepts
- Using FastAcq
- How the Analog Acquisition Modes Work
- Changing the Acquisition Mode, Record Length, and Delay Time
- Using Roll Mode
- Act on Event
- Setting Up a Serial or Parallel Bus
- Setting Up Digital Channels
- When and Why to Turn On MagniVu
- Using MagniVu
- Setting Up the RF Inputs
- Trigger Setup
- Display Waveform or Trace Data
- Adding and Removing a Waveform
- Setting the Display Style and Persistence
- Setting Waveform Intensity
- Scaling and Positioning a Waveform
- Setting Input Parameters
- Positioning and Labeling Bus Signals
- Positioning, Scaling, and Grouping Digital Channels
- Viewing Digital Channels
- Annotating the Screen
- Viewing the Trigger Frequency
- Displaying the Frequency Domain Menu
- Analyze Waveform or Trace Data
- Using Markers in the Frequency Domain
- Taking Automatic Measurements in the Time Domain
- Selecting Automatic Measurements in the Time Domain
- Customizing an Automatic Measurement in the Time Domain
- Taking Automatic Measurements in the Frequency Domain
- Taking Digital Voltmeter Measurements
- Taking Manual Measurements with Cursors
- Setting Up a Histogram
- Using Math Waveforms
- Using FFT
- Using Advanced Math
- Using Spectrum Math
- Using Reference Waveforms and Traces
- Using Wave Inspector to Manage Long Record Length Waveforms
- Auto-magnify
- Limit and Mask Testing
- Making Video Tests
- Making Automated Power Measurements
- Save and Recall Information
- Use the Arbitrary Function Generator
- Use the Application Modules
- Appendix A: Warranted Specifications
- Appendix B: TPP0250, TPP0500B and TPP1000: 250€MHz, 500€MHz and
- Appendix C: P6316 General-Purpose Logic Probe Information
- Appendix D: OpenSSL License
Display Wavefor
morTraceData
8. To group some or all of the digital channels
together, move the channels right next to
each other. Al
l the channels that are next to
each other automatically form a group.
You can see the groups by pushing
Select on the
side menu and turning the
Multipurpose a knob.
When a group is selected, turn
Multipurpos
ebto move the whole
group.
Viewing Digital Channels
The various ways of displaying data from the digital channels help you analyze the signals. Digital c hannels s tore a high or
low state for each sample.
Logic high levels are displayed in green. Logic low levels are displayed in blue. When a single transition occurs during the time
represented by one pixel c olumn, the transition (edge) is displayed in gray.
When multiple transitions occur during the time
represented by one pixel column, the transition (edge)
is displayed in white.
When the display shows a white edge, indicating multiple
transitions, you may be able to zoom in and see the
individual edges.
When you are zoomed in so far that there is more than
one pixel column per sample, the uncertainty of the edge
position is indicated b y light gray shading.
NOTE. When the light gray shading is displayed, use
MagniVu.
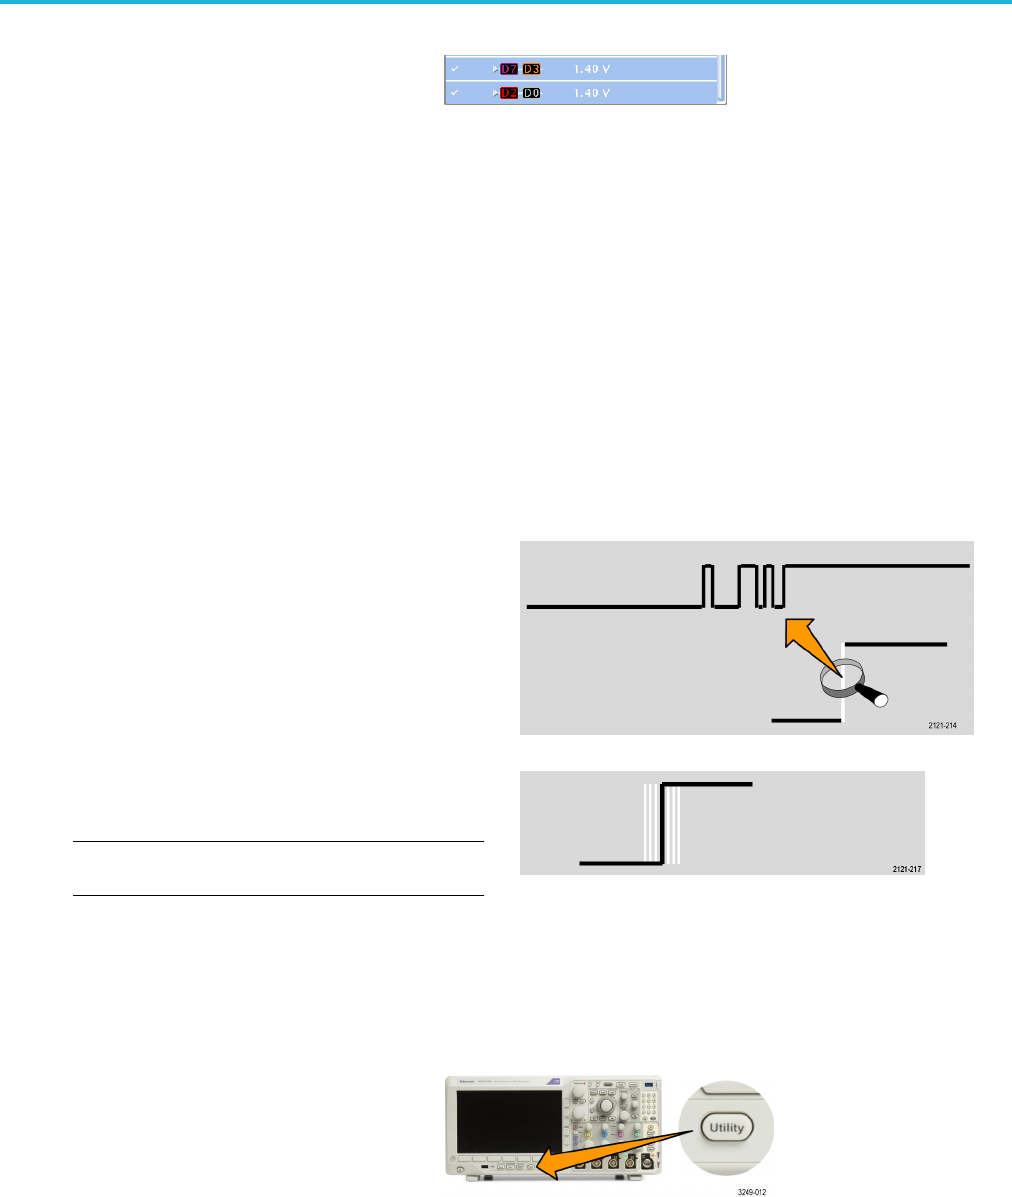
Annotating the Screen
You can add your own text to the screen by doing the following:
1. Push Utility.
MDO3000 Series Oscilloscopes User Manual 115