
User Manual
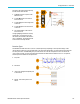
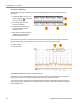
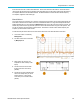
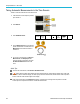
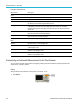
Table Of Contents
- toc
- Important safety information
- Compliance information
- Preface
- Installation
- Before Installation
- Operating Considerations
- Connecting Probes
- Securing the Oscilloscope
- Powering on the Oscilloscope
- Powering off the Oscilloscope
- Functional Check
- Compensating a TPP0250, TPP0500B or TPP1000 Passive Voltage Prob
- Compensating a non-TPP0250, non-TPP0500B or non-TPP1000 Passive
- Application Module Free Trial
- Installing an Application Module
- Upgrading Bandwidth
- Changing the Language of the User Interface or Keyboard
- Changing the Date and Time
- Signal Path Compensation
- Upgrading Firmware
- Connecting Your Oscilloscope to a Computer
- Connecting a USB Keyboard to Your Oscilloscope
- Get Acquainted with the Instrument
- Acquire the Signal
- Setting Up Analog Channels
- Using the Default Setup
- Using Autoset
- Acquisition Concepts
- Using FastAcq
- How the Analog Acquisition Modes Work
- Changing the Acquisition Mode, Record Length, and Delay Time
- Using Roll Mode
- Act on Event
- Setting Up a Serial or Parallel Bus
- Setting Up Digital Channels
- When and Why to Turn On MagniVu
- Using MagniVu
- Setting Up the RF Inputs
- Trigger Setup
- Display Waveform or Trace Data
- Adding and Removing a Waveform
- Setting the Display Style and Persistence
- Setting Waveform Intensity
- Scaling and Positioning a Waveform
- Setting Input Parameters
- Positioning and Labeling Bus Signals
- Positioning, Scaling, and Grouping Digital Channels
- Viewing Digital Channels
- Annotating the Screen
- Viewing the Trigger Frequency
- Displaying the Frequency Domain Menu
- Analyze Waveform or Trace Data
- Using Markers in the Frequency Domain
- Taking Automatic Measurements in the Time Domain
- Selecting Automatic Measurements in the Time Domain
- Customizing an Automatic Measurement in the Time Domain
- Taking Automatic Measurements in the Frequency Domain
- Taking Digital Voltmeter Measurements
- Taking Manual Measurements with Cursors
- Setting Up a Histogram
- Using Math Waveforms
- Using FFT
- Using Advanced Math
- Using Spectrum Math
- Using Reference Waveforms and Traces
- Using Wave Inspector to Manage Long Record Length Waveforms
- Auto-magnify
- Limit and Mask Testing
- Making Video Tests
- Making Automated Power Measurements
- Save and Recall Information
- Use the Arbitrary Function Generator
- Use the Application Modules
- Appendix A: Warranted Specifications
- Appendix B: TPP0250, TPP0500B and TPP1000: 250€MHz, 500€MHz and
- Appendix C: P6316 General-Purpose Logic Probe Information
- Appendix D: OpenSSL License
Display Wavefor
morTraceData
The figure to the right shows the frequency
domain window’s trace indicator.
1. An RF trace indicator is placed at the
Reference Lev
el.
2. A capital M app
ears if the maximum
trace is turned on.
3. A capital A appears if the average trace
is turned on.
4. A capital N appears if the normal trace
is turned on
.
5. The small m a
ppears if the minimum
trace is turned on.
Orange highlighting indicates the currently
selected t
race. In the figure to the right,
the small m, which stands for the minimum
trace, is highlighted. This indicates that the
minimum t
race is currently selec ted.
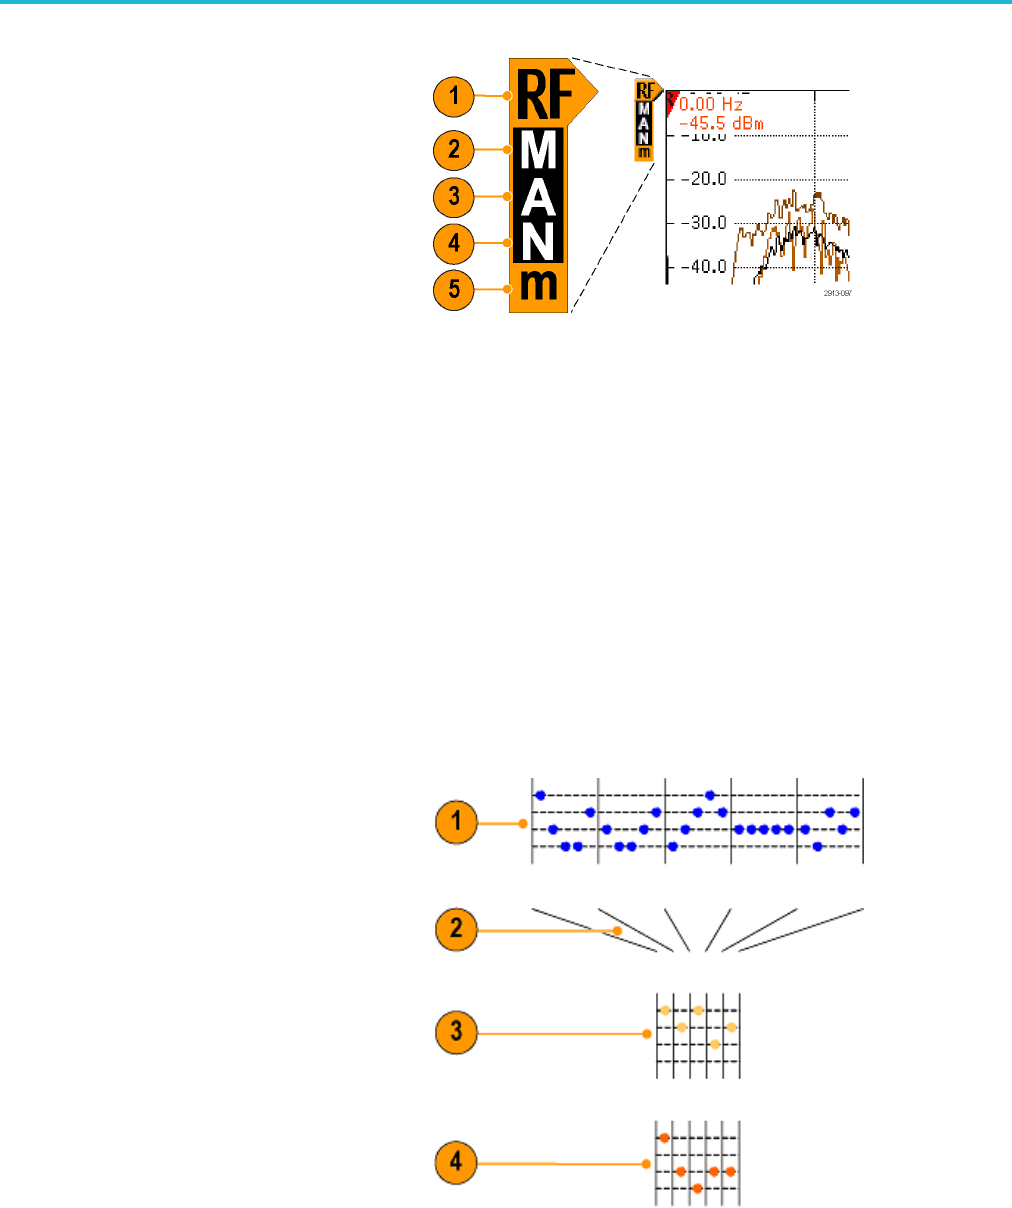
Detection Types
The MDO3000 calculates FFTs with a 1,000 to ~2,000,000 point output, depending on the acquisition settings. It then
reduces that FFT output into a 750 pixel-wide display. This means that approximately 1 to 2,000 FFT points get compressed
into each pixel column. The MDO3000 gives you several choices as to how this compression is done. The choices are:
+peak, sample, average, and -peak. The figure below illustrates how these detection methods work in a 5:1 compression,
where five points are reduced to each pixel column.
1. FFT points
2. Decimation
3. +Peak
: Uses the highest amplitude point
in each interval.
4. Sample: Uses the first point in each
interval.
MDO3000 Series Oscilloscopes User Manual 119