
User Manual
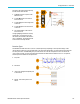
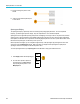
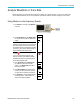
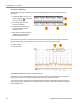
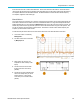
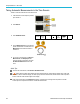
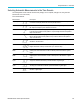
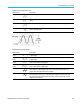
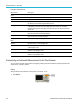
Table Of Contents
- toc
- Important safety information
- Compliance information
- Preface
- Installation
- Before Installation
- Operating Considerations
- Connecting Probes
- Securing the Oscilloscope
- Powering on the Oscilloscope
- Powering off the Oscilloscope
- Functional Check
- Compensating a TPP0250, TPP0500B or TPP1000 Passive Voltage Prob
- Compensating a non-TPP0250, non-TPP0500B or non-TPP1000 Passive
- Application Module Free Trial
- Installing an Application Module
- Upgrading Bandwidth
- Changing the Language of the User Interface or Keyboard
- Changing the Date and Time
- Signal Path Compensation
- Upgrading Firmware
- Connecting Your Oscilloscope to a Computer
- Connecting a USB Keyboard to Your Oscilloscope
- Get Acquainted with the Instrument
- Acquire the Signal
- Setting Up Analog Channels
- Using the Default Setup
- Using Autoset
- Acquisition Concepts
- Using FastAcq
- How the Analog Acquisition Modes Work
- Changing the Acquisition Mode, Record Length, and Delay Time
- Using Roll Mode
- Act on Event
- Setting Up a Serial or Parallel Bus
- Setting Up Digital Channels
- When and Why to Turn On MagniVu
- Using MagniVu
- Setting Up the RF Inputs
- Trigger Setup
- Display Waveform or Trace Data
- Adding and Removing a Waveform
- Setting the Display Style and Persistence
- Setting Waveform Intensity
- Scaling and Positioning a Waveform
- Setting Input Parameters
- Positioning and Labeling Bus Signals
- Positioning, Scaling, and Grouping Digital Channels
- Viewing Digital Channels
- Annotating the Screen
- Viewing the Trigger Frequency
- Displaying the Frequency Domain Menu
- Analyze Waveform or Trace Data
- Using Markers in the Frequency Domain
- Taking Automatic Measurements in the Time Domain
- Selecting Automatic Measurements in the Time Domain
- Customizing an Automatic Measurement in the Time Domain
- Taking Automatic Measurements in the Frequency Domain
- Taking Digital Voltmeter Measurements
- Taking Manual Measurements with Cursors
- Setting Up a Histogram
- Using Math Waveforms
- Using FFT
- Using Advanced Math
- Using Spectrum Math
- Using Reference Waveforms and Traces
- Using Wave Inspector to Manage Long Record Length Waveforms
- Auto-magnify
- Limit and Mask Testing
- Making Video Tests
- Making Automated Power Measurements
- Save and Recall Information
- Use the Arbitrary Function Generator
- Use the Application Modules
- Appendix A: Warranted Specifications
- Appendix B: TPP0250, TPP0500B and TPP1000: 250€MHz, 500€MHz and
- Appendix C: P6316 General-Purpose Logic Probe Information
- Appendix D: OpenSSL License
Display Wavefor
morTraceData
5. Average: Avera
ges all points in each
interval.
6. –P eak: Uses the lowest amplitude point
in each interval.
Spectrogra
mDisplay
The spectrogram display is particularly useful for monitoring slowly-changing RF phenomena. The x-axis represents
frequency, just like the typical spectrum display. The y-axis represents time. Color indicates amplitude.
Spectrogram slices are generated by taking each spectrum and flipping it on its edge so that it is one pixel row tall, and then
assigning colors to each pixel based on the amplitude at that frequency with the cold colors of blue and green representing
low amplitude, and the hotter colors of yellow and red indicating higher amplitude. Each new acquisition adds another slice at
the bottom of the spectrogram, and the history moves up one row.
When acquisitions are stopped, you can navigate through the history of the spectrogram by pressing the side menu slice
control and turning the Multipur pose a knob. When acquisitions are stopped and the spectrogram is displayed, the
spectrogram slice trace is displayed a s the Normal spectrum trace.
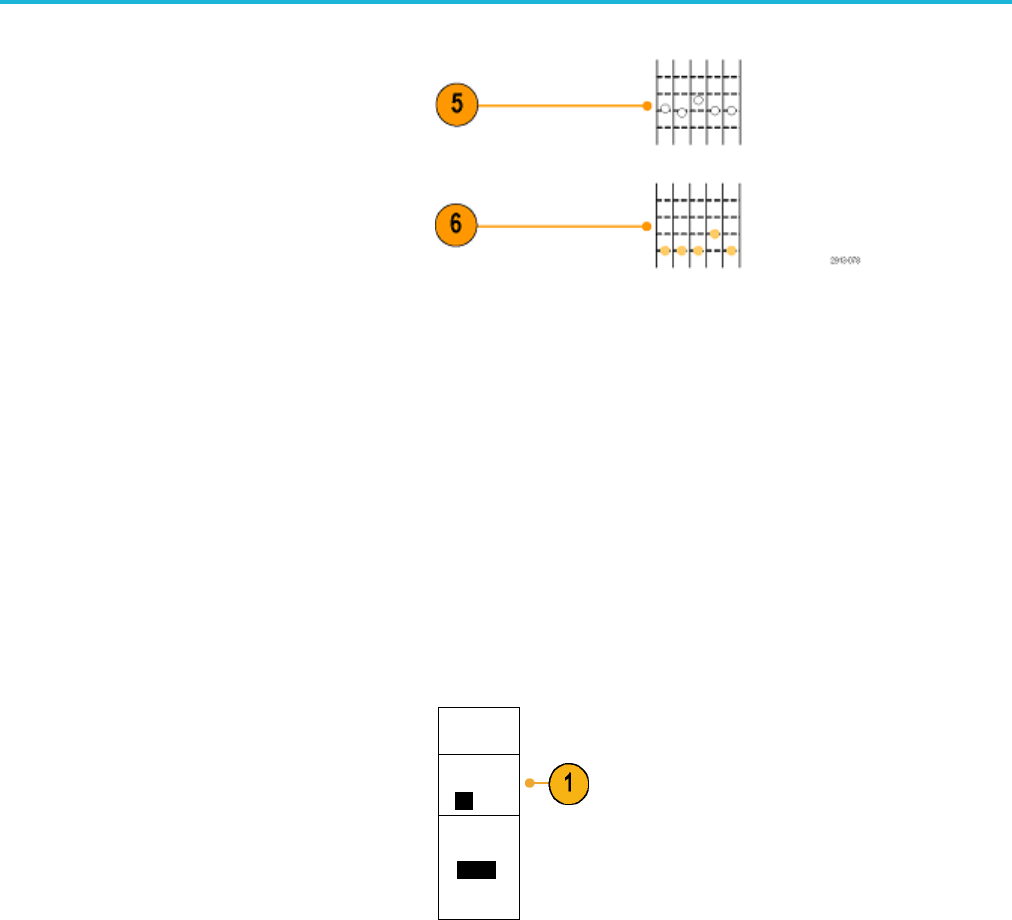
To use the spectrogram feature, push Spectrogram from the RF Menu to bring up the related side menu.
Spectro-
gram
1. Push Display to On to start the spectrogram.
Display
On|Off
2. To review each spectrum captured in
the spectrogram, push Run / Stop to
stop acquiring RF acquisitions. Turn
Multipurpose a.
Slice
(Normal)
(a) -45
120 MDO3000 Series Oscilloscopes User Manual