
User Manual
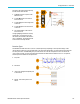
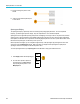
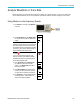
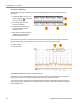
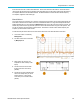
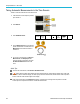
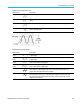
Table Of Contents
- toc
- Important safety information
- Compliance information
- Preface
- Installation
- Before Installation
- Operating Considerations
- Connecting Probes
- Securing the Oscilloscope
- Powering on the Oscilloscope
- Powering off the Oscilloscope
- Functional Check
- Compensating a TPP0250, TPP0500B or TPP1000 Passive Voltage Prob
- Compensating a non-TPP0250, non-TPP0500B or non-TPP1000 Passive
- Application Module Free Trial
- Installing an Application Module
- Upgrading Bandwidth
- Changing the Language of the User Interface or Keyboard
- Changing the Date and Time
- Signal Path Compensation
- Upgrading Firmware
- Connecting Your Oscilloscope to a Computer
- Connecting a USB Keyboard to Your Oscilloscope
- Get Acquainted with the Instrument
- Acquire the Signal
- Setting Up Analog Channels
- Using the Default Setup
- Using Autoset
- Acquisition Concepts
- Using FastAcq
- How the Analog Acquisition Modes Work
- Changing the Acquisition Mode, Record Length, and Delay Time
- Using Roll Mode
- Act on Event
- Setting Up a Serial or Parallel Bus
- Setting Up Digital Channels
- When and Why to Turn On MagniVu
- Using MagniVu
- Setting Up the RF Inputs
- Trigger Setup
- Display Waveform or Trace Data
- Adding and Removing a Waveform
- Setting the Display Style and Persistence
- Setting Waveform Intensity
- Scaling and Positioning a Waveform
- Setting Input Parameters
- Positioning and Labeling Bus Signals
- Positioning, Scaling, and Grouping Digital Channels
- Viewing Digital Channels
- Annotating the Screen
- Viewing the Trigger Frequency
- Displaying the Frequency Domain Menu
- Analyze Waveform or Trace Data
- Using Markers in the Frequency Domain
- Taking Automatic Measurements in the Time Domain
- Selecting Automatic Measurements in the Time Domain
- Customizing an Automatic Measurement in the Time Domain
- Taking Automatic Measurements in the Frequency Domain
- Taking Digital Voltmeter Measurements
- Taking Manual Measurements with Cursors
- Setting Up a Histogram
- Using Math Waveforms
- Using FFT
- Using Advanced Math
- Using Spectrum Math
- Using Reference Waveforms and Traces
- Using Wave Inspector to Manage Long Record Length Waveforms
- Auto-magnify
- Limit and Mask Testing
- Making Video Tests
- Making Automated Power Measurements
- Save and Recall Information
- Use the Arbitrary Function Generator
- Use the Application Modules
- Appendix A: Warranted Specifications
- Appendix B: TPP0250, TPP0500B and TPP1000: 250€MHz, 500€MHz and
- Appendix C: P6316 General-Purpose Logic Probe Information
- Appendix D: OpenSSL License
Analyze Wavefor
morTraceData
Automatic Peak Markers
Automatic peak markers are on by default and assist with quickly identifying the frequency and amplitude of peaks in
the spectrum.
1. The Reference Marker is placed on the
highest amplitude peak. It is marked with
a red R in a triangle.
2. The automatic markers indicate
frequency a
nd amplitude.
3. Absolute re
adouts show the actual
frequency and amplitude of the
automatic markers.
4. Delta readouts s how the frequency and
amplitude
of the automatic markers
relative to the reference marker.
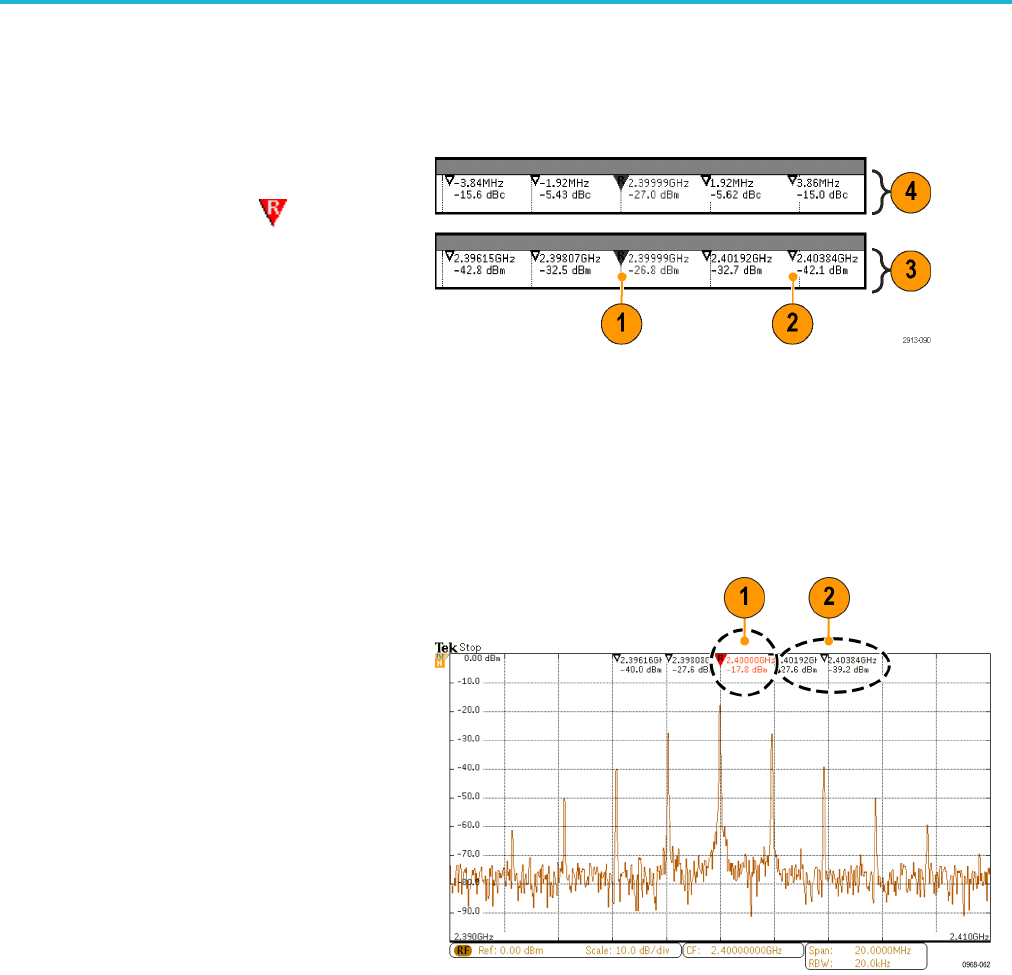
In the screen shot shown below, a marker has been placed on each of the obvious peaks in the display. The Reference
Marker is the highest peak. It i s marked with the red R in a triangle, and its readout is shown in red text.
1. Referen
ce marker
2. Automat
ic markers
Use Threshold and Excursion to define which peaks are marked.
The threshold is a minimum amplitude that a signal must cross to be a valid peak. If the threshold is lower, more peaks will
tend to qualify to have markers. If the threshold is higher, fewer peaks tend to qualify to have markers.
The excursion is how far a signal needs to fall in amplitude between marked peaks to be another valid peak. If the excursion
is low, more peaks will tend to qualify to have a ssociated markers . If the excursion is high, fewer peaks will tend to qualify to
have associated markers.
122 MDO3000 Series Oscilloscopes User Manual